Monitor agents in the web UI
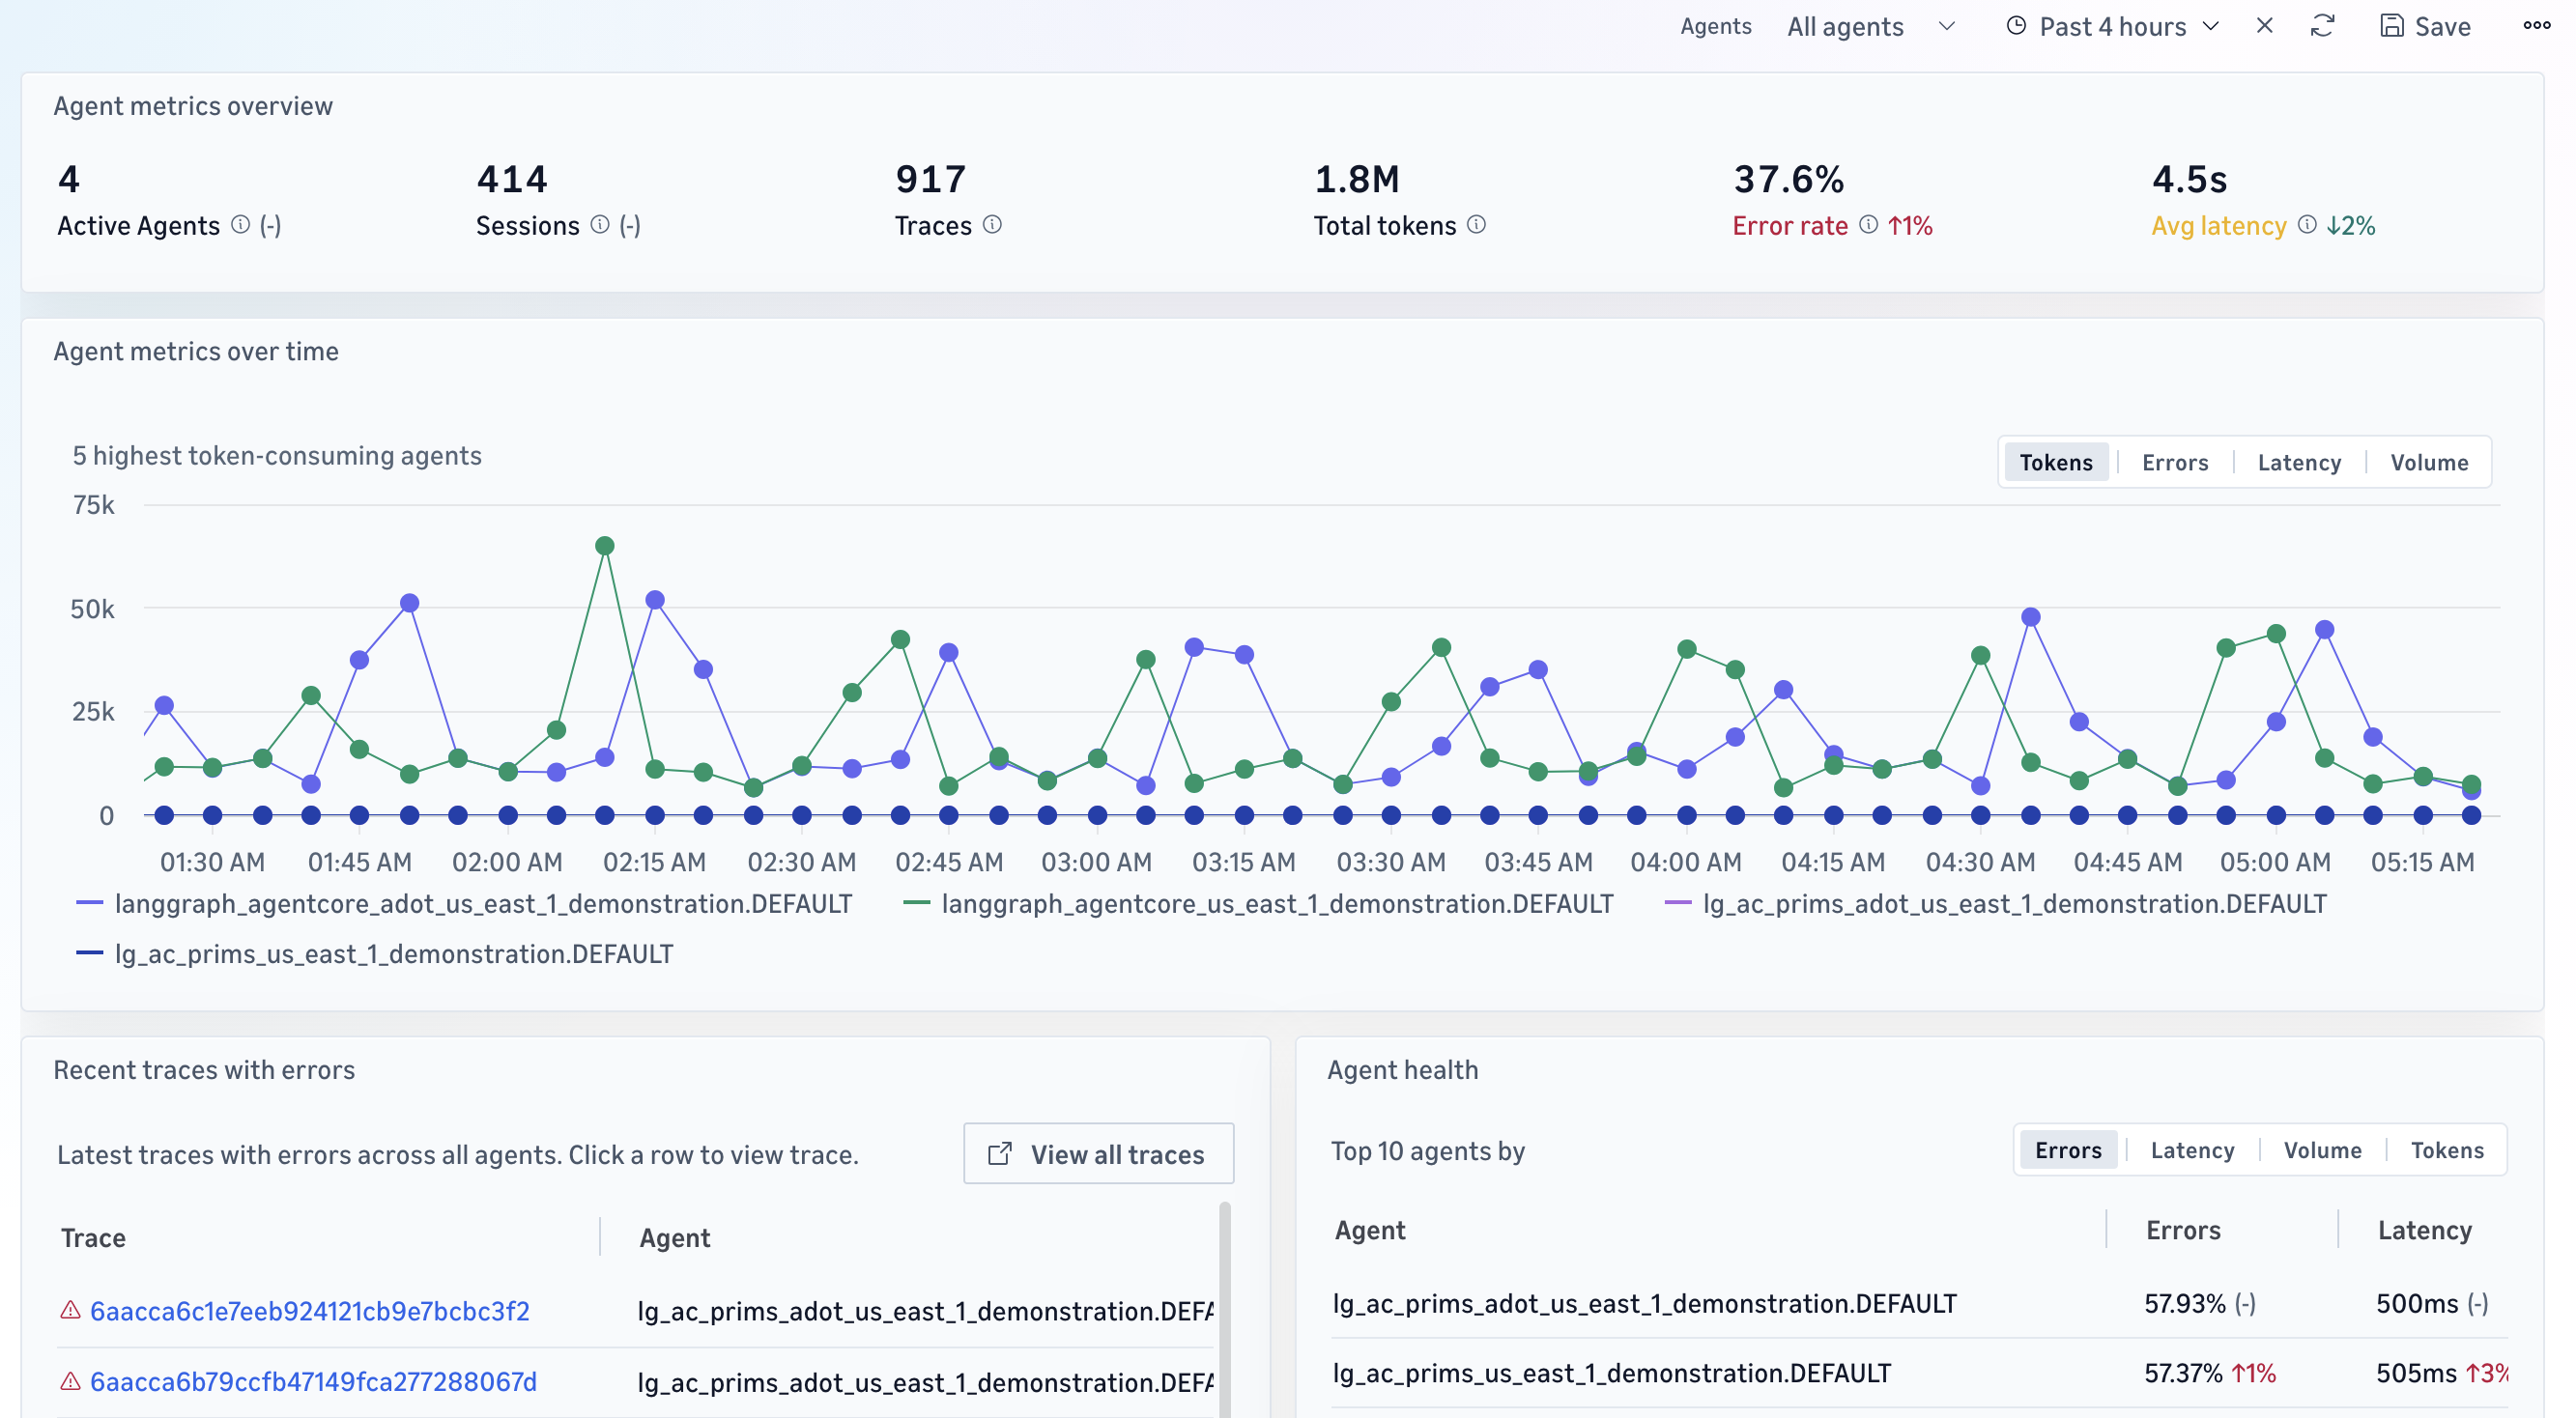
Use the Omni web UI to monitor your agents in production, including individual agent traces and sessions, aggregate metrics such as request volume, errors, latency, and token usage, and dependency relationships through the application map (see Monitor applications with the application map).
Aggregate views are available in the Omni web UI only. For monitoring and troubleshooting during development in the IDE, see Develop with the IDE extension.
Aggregate metrics
-
Request volume — the number of times the agent is invoked.
-
Errors — the number of traces that contain errors.
-
Latency — the duration of each run.
-
Token usage — the total input and output tokens consumed.
To monitor your agents
-
Sign in to your space. To set up users and permissions, see Set up Omni.
-
Review the aggregate views for request volume, errors, latency, and token usage across your agents. Filter by agent or time range.
-
Select a metric or a spike to view the underlying traces in Agent traces, or follow a multi-turn conversation in Agent sessions. If you do not yet know which runs to inspect, use the agent topology to see which components take part. See Agent topology.
-
Check your evaluation results for the same period. To find evaluation trends, see Evaluators and evaluations.
Combine these views with evaluation results. An agent can be fast, low-cost, and error-free but still give wrong answers. To measure response quality, see Evaluate agent quality. When you find a quality regression here, follow Tutorial: Fix a production quality regression.