Help improve this page
To contribute to this user guide, choose the Edit this page on GitHub link that is located in the right pane of every page.
Set up Amazon EKS cluster for AI/ML workloads using CLIs
Tip
Register
This section walks you through the steps to create the infrastructure required to run training or inference workloads on Amazon EKS by using CLI commands. The steps include creating an EKS cluster with EKS Auto Mode or Karpenter for node auto-scaling, load balancing for in-cluster endpoints, a monitoring stack with Prometheus and Grafana, and Amazon S3 storage for model weights. You create the GPU NodePool that provisions GPU-enabled nodes in the Create a GPU NodePool for AI/ML inference section.
See the documentation for EKS Auto Mode and Karpenter
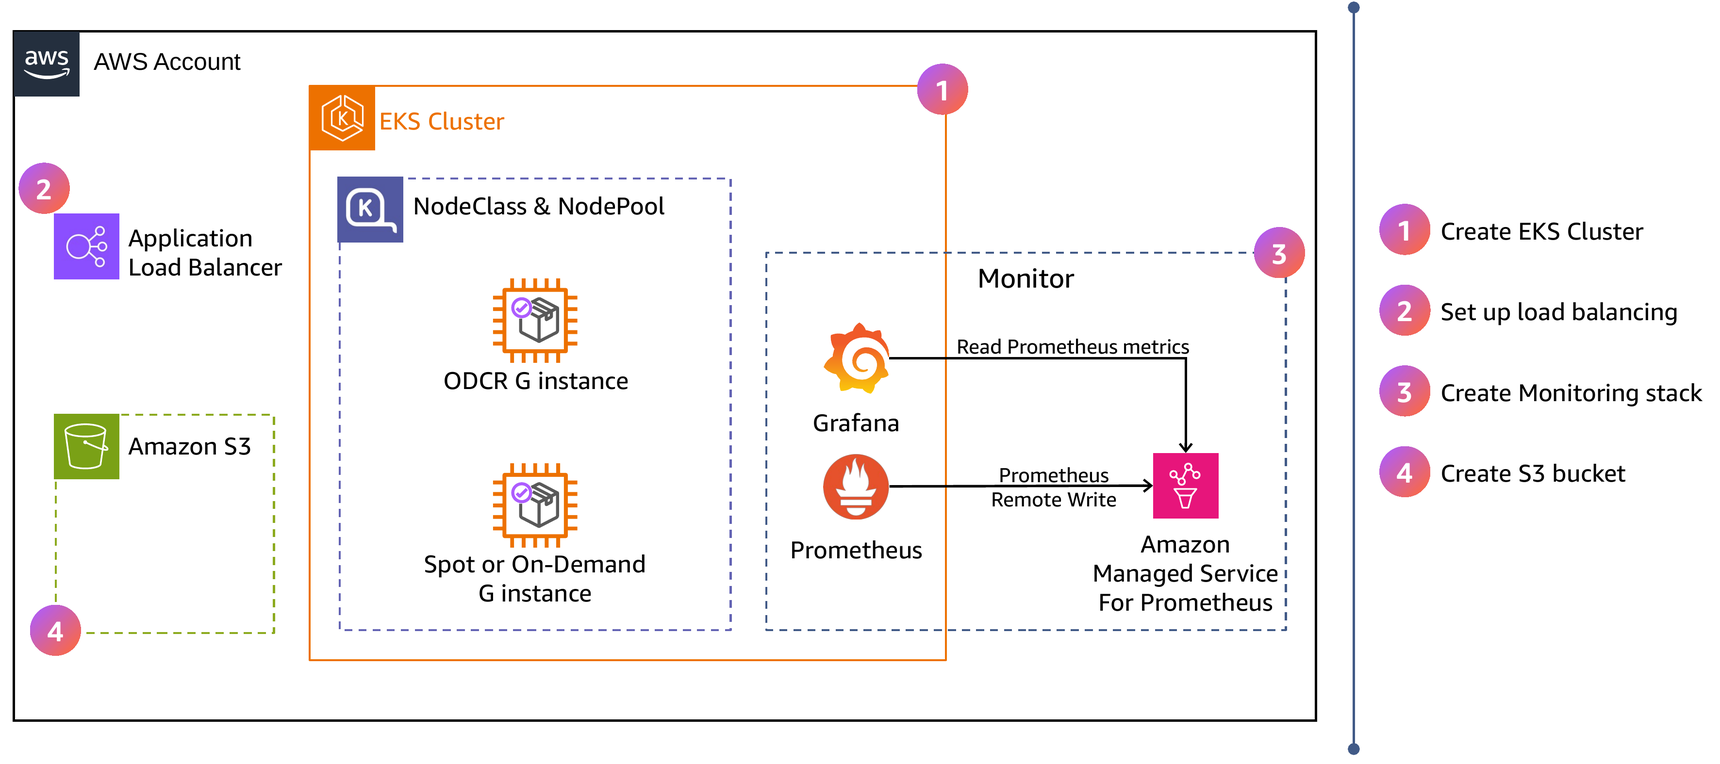
The following diagram shows the AWS high-level architecture for this section’s setup. Inside your AWS account, the EKS cluster uses a NodeClass and NodePool to provision an On-Demand Capacity Reservation (ODCR) G instance and a Spot or On-Demand G instance. The NodeClass and NodePool are shown for context; you create them in the Create a GPU NodePool for AI/ML inference section.
In the monitoring stack, Prometheus remote writes metrics to Amazon Managed Service for Prometheus, and Grafana reads them. An Amazon S3 bucket stores model weights.
The numbered steps in the following diagram and its legend indicate the order in which you complete the configuration:
Note
The components you install here that target GPU nodes are DaemonSets, so they report zero Pods until GPU nodes join the cluster. This includes the NVIDIA device plugin on the self-managed Karpenter path and the NVIDIA DCGM Exporter in the monitoring stack. After you create the GPU NodePool and a GPU node joins the cluster, Kubernetes schedules these DaemonSets onto it automatically. GPU metrics and the GPU dashboards in Grafana stay empty until then.
Skip to Create a GPU NodePool for AI/ML inference if you already have a cluster running with all of the necessary components.
Prerequisites
Important
The resources you create in this tutorial, including EKS clusters, GPU instances, Application Load Balancers, and Amazon Managed Service for Prometheus, incur charges. Delete resources when you finish to avoid ongoing charges.
-
kubectl>= 1.37. For setup instructions, see Set up kubectl and eksctl. -
AWS CLI >= 2.27. For setup instructions, see Installing.
-
Helm >= 3.14. For setup instructions, see Setup Helm.
-
jq. For setup instructions, see Download jq. -
eksctl>= 0.227.0. For setup instructions, see Installationin the eksctldocumentation.
Verify your eksctl version:
eksctl version
If you are on a version older than 0.227.0, follow the eksctl installation guide
Set environment variables
Keep the following cluster name and AWS Region consistent throughout these steps. Changing it might cause subsequent commands to target the wrong EKS cluster.
export CLUSTER_NAME=ai-eks-docs
export AWS_REGION=us-east-2
Important
Use a cluster name that no other cluster in the Region is already using, including a cluster from a previous run of this guide or from Set up Amazon EKS cluster for AI/ML workloads using Terraform, which uses the same default name. On the self-managed Karpenter path, the cluster name is also the value of the karpenter.sh/discovery tag that Karpenter uses to find subnets and security groups. If a second cluster, or an incompletely deleted one, carries the same tag, Karpenter selects subnets and security groups from both VPCs and every node launch fails with an InvalidParameter error that reports that a security group and a subnet belong to different networks.
Using all available AZs improves fault tolerance and increases the chances of obtaining GPU capacity:
export AZS=$(aws ec2 describe-availability-zones \
  --region ${AWS_REGION} \
  --query "AvailabilityZones[?ZoneId!='use1-az3' && ZoneId!='usw1-az2' && ZoneId!='cac1-az3'].ZoneName" \
  --output text | tr '\t' ',')
echo $AZS
Important
The Availability Zones use1-az3, usw1-az2, and cac1-az3 are excluded because Amazon EKS does not support control plane placement in those zonesUnsupportedAvailabilityZoneException.
Expected output:
us-east-2a,us-east-2b,us-east-2c
The AZs in the output vary per Region. This example shows the available AZs for the us-east-2 Region.
Step 1: Create the cluster
This section provides two paths for creating your EKS cluster, shown in the following diagram. Choose only one option throughout the guide.
-
EKS Auto Mode — In addition to the core networking, storage, and load balancing add-ons, EKS Auto Mode includes and manages the following capabilities for training and inference workloads: EKS node monitoring agent, automatic node repair, SOCI
snapshotter for fast container pulls, and GPU readiness for the default NodeClass. The NVIDIA device plugin is included in the Bottlerocket accelerated AMI that EKS Auto Mode uses for GPU-enabled nodes. -
Self-managed Karpenter — On an EKS cluster without EKS Auto Mode, you are responsible for installing and configuring the components required for training and inference workloads. This includes networking add-ons (VPC CNI, CoreDNS, kube-proxy), Karpenter, the EKS node monitoring agent, the NVIDIA device plugin, and SOCI snapshotter for fast container pulls.
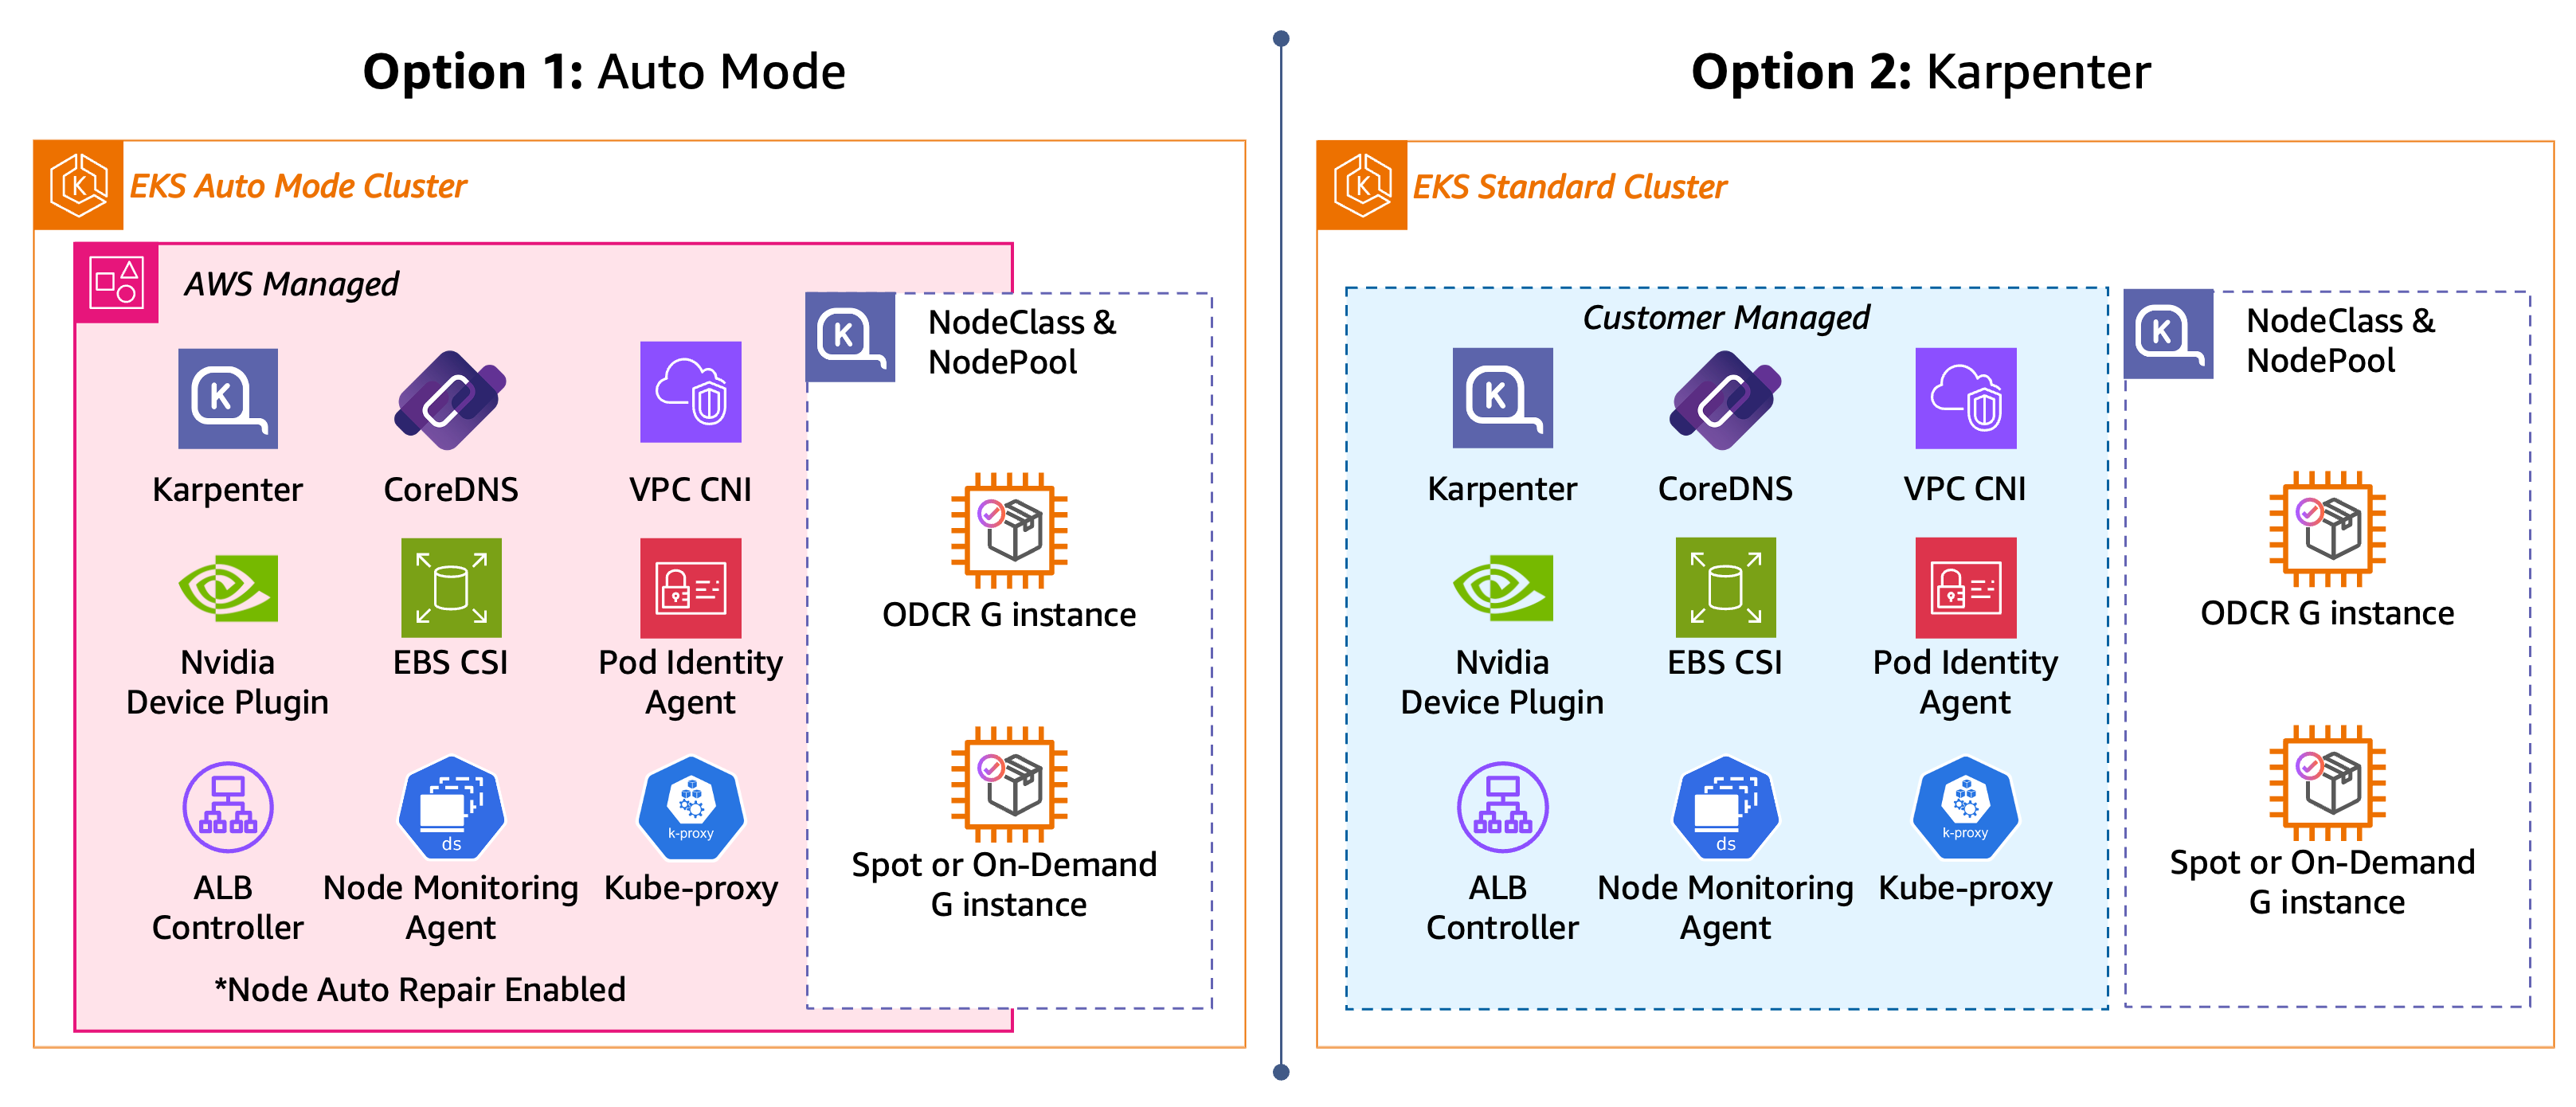
In each of the following steps, choose a path (EKS Auto Mode, Karpenter) and follow it throughout. After completing the steps for your chosen path, you’ll have an EKS cluster ready for GPU workloads. You create the GPU NodePool that schedules GPU workloads in the Create a GPU NodePool for AI/ML inference section.
Start by creating your EKS cluster and installing the cluster components needed for GPU workloads.
With EKS Auto Mode, a single eksctl create cluster --enable-auto-mode command provisions an EKS cluster that’s ready for GPU workloads.
With self-managed Karpenter, the eksctl create cluster command provisions the core networking add-ons, then additional steps are needed to enable automatic node repair through a Karpenter feature gate, install the EKS node monitoring agent, and install the NVIDIA device plugin.
Warning
For both the EKS Auto Mode and self-managed Karpenter paths, automatic node repair behaves the same way for nodes provisioned by NodePools. Automatic node repair in EKS Auto Mode and Karpenter is a forceful disruption method that bypasses PodDisruptionBudgets, the karpenter.sh/do-not-disrupt annotation, and terminationGracePeriod. Automatic node repair waits 10 minutes before replacing a node with the AcceleratedHardwareReady condition set to False and 30 minutes for other repair conditions.
Step 2: Set up load balancing
Later steps in this guide expose Grafana (and, in the inference walkthrough, a model endpoint) through an AWS Application Load Balancer (ALB). Set up the load balancing prerequisites now so those sections can create an Ingress without further setup.
The ALB is placed in your VPC subnets based on AWS resource tags. Public subnets used for internet-facing load balancers must be tagged kubernetes.io/role/elb = 1, and private subnets used for internal load balancers must be tagged kubernetes.io/role/internal-elb = 1. Because you created this cluster with eksctl, those tags already exist on the subnets eksctl created. If you bring your own VPC or imported subnets, tag them manually. For details, see Tag subnets for EKS Auto Mode.
The rest of the setup differs by path. EKS Auto Mode includes a built-in ALB controller, so you create an IngressClass yourself. Self-managed Karpenter requires installing the AWS Load Balancer Controller with Helm, and the Helm chart creates the IngressClass for you.
Both paths now have an alb
IngressClass. The Grafana and inference sections reference ingressClassName: alb and set the ALB scheme, source-IP allowlist, and other behavior through per-Ingress annotations.
Step 3: Create the monitoring stack
Install a monitoring stack that collects cluster, node, and GPU metrics into Amazon Managed Service for Prometheus (AMP), and visualize them with Grafana. The kube-prometheus-stack Helm chart deploys Prometheus to scrape and remote-write metrics to AMP, plus a self-managed Grafana for dashboards. The NVIDIA DCGM Exporter adds GPU-specific metrics (utilization, memory, temperature, power, NVLink, tensor activity).
Prometheus, Grafana, and the operator land on non-GPU nodes by default because GPU nodes carry the nvidia.com/gpu:NoSchedule taint. Node-exporter and the DCGM Exporter both tolerate that taint, so they scrape host and GPU metrics fleet-wide after GPU nodes join the cluster.
If you opened a new terminal, set the cluster name and region:
export CLUSTER_NAME=ai-eks-docs
export AWS_REGION=us-east-2
Create the AMP workspace
Create an AMP workspace to store metrics:
aws amp create-workspace \
  --alias "amp-ws-${CLUSTER_NAME}" \
  --region ${AWS_REGION}
Get the workspace ID:
AMP_WORKSPACE_ID=$(aws amp list-workspaces \
  --alias "amp-ws-${CLUSTER_NAME}" \
  --query 'workspaces[0].workspaceId' \
  --output text \
  --region ${AWS_REGION})

echo "AMP Workspace ID: ${AMP_WORKSPACE_ID}"
Get the remote-write endpoint:
AMP_ENDPOINT=$(aws amp describe-workspace \
  --workspace-id ${AMP_WORKSPACE_ID} \
  --query 'workspace.prometheusEndpoint' \
  --output text \
  --region ${AWS_REGION})

echo "AMP Endpoint: ${AMP_ENDPOINT}"
Create IAM policy and EKS Pod Identity associations
Create an IAM policy that allows Prometheus to remote-write metrics and Grafana to query them:
ACCOUNT_ID=$(aws sts get-caller-identity --query Account --output text)

AMP_POLICY_ARN=$(aws iam create-policy \
  --policy-name "${CLUSTER_NAME}-amp-grafana-policy" \
  --policy-document "{\"Version\": \"2012-10-17\", \"Statement\": [{\"Sid\": \"AllowAMPReadWrite\", \"Effect\": \"Allow\", \"Action\": [\"aps:ListWorkspaces\", \"aps:DescribeWorkspace\", \"aps:GetMetricMetadata\", \"aps:GetSeries\", \"aps:QueryMetrics\", \"aps:RemoteWrite\", \"aps:GetLabels\"], \"Resource\": \"arn:aws:aps:${AWS_REGION}:${ACCOUNT_ID}:workspace/*\"}, {\"Sid\": \"AllowCloudWatchMetrics\", \"Effect\": \"Allow\", \"Action\": [\"cloudwatch:DescribeAlarmsForMetric\", \"cloudwatch:ListMetrics\", \"cloudwatch:GetMetricData\", \"cloudwatch:GetMetricStatistics\"], \"Resource\": \"*\"}]}" \
  --query 'Policy.Arn' \
  --output text)

echo "AMP Policy ARN: ${AMP_POLICY_ARN}"
Create the monitoring namespace and the service account for Grafana. The kube-prometheus-stack chart creates the Prometheus service account when you install it:
kubectl create namespace monitoring
kubectl create serviceaccount grafana-sa -n monitoring
Create EKS Pod Identity Associations to link the service accounts to the IAM policy:
eksctl create podidentityassociation \
  --cluster ${CLUSTER_NAME} \
  --namespace monitoring \
  --service-account-name amp-iamproxy-ingest-service-account \
  --role-name "${CLUSTER_NAME}-amp-ingest-role" \
  --permission-policy-arns ${AMP_POLICY_ARN} \
  --region ${AWS_REGION}

eksctl create podidentityassociation \
  --cluster ${CLUSTER_NAME} \
  --namespace monitoring \
  --service-account-name grafana-sa \
  --role-name "${CLUSTER_NAME}-grafana-role" \
  --permission-policy-arns ${AMP_POLICY_ARN} \
  --region ${AWS_REGION}
Verify both EKS Pod Identity associations were created:
eksctl get podidentityassociation --cluster ${CLUSTER_NAME} --region ${AWS_REGION}
Expected output should include both amp-iamproxy-ingest-service-account and grafana-sa in the monitoring namespace.
Install kube-prometheus-stack
Add the Helm repo:
helm repo add prometheus-community https://prometheus-community.github.io/helm-charts
helm repo update
This values file omits a nodeSelector for Prometheus, Grafana, and the operator: the GPU nodes' nvidia.com/gpu:NoSchedule taint keeps them off GPU nodes, so they land on the system or general-purpose pool by default. Node-exporter uses a wildcard toleration so it runs on every node — including GPU nodes — to collect metrics fleet-wide.
The values file also configures a Grafana Ingress so the chart provisions an internet-facing ALB for browser access, using the alb
IngressClass you created in Set up load balancing. The alb.ingress.kubernetes.io/inbound-cidrs annotation restricts the load balancer to your own IP address, so set it before you install.
Grafana is publicly accessible over HTTP with default credentials
Grafana includes default admin credentials and provides full administrative access to your monitoring data. An internet-facing load balancer places this interface on the public internet over plain text HTTP. Automated scanners discover public load balancers within minutes. You must restrict access with the alb.ingress.kubernetes.io/inbound-cidrs annotation, and treat source-IP allowlisting as a minimum safeguard, not a complete one. Also change the default Grafana admin password. For a stronger posture, use an internal scheme (reachable only from within your VPC or a connected VPN) by setting the scheme to internal, and add a TLS certificate.
Find your public IP address and store it as a /32 CIDR. The values file reads this from the MY_CIDR environment variable:
export MY_CIDR="$(curl -s https://checkip.amazonaws.com)/32"
echo $MY_CIDR
The result looks like 203.0.113.4/32. If your network assigns addresses dynamically, your IP address might change over time, so consider setting a broader range such as 203.0.113.0/24.
Create the values file:
Example kube-prometheus-stack values file
cat << EOF > /tmp/kube-prometheus-values.yaml
alertmanager:
  enabled: false

prometheus-adapter:
  enabled: false

prometheus:
  serviceAccount:
    create: true
    name: amp-iamproxy-ingest-service-account
  prometheusSpec:
    serviceAccountName: amp-iamproxy-ingest-service-account
    enableRemoteWriteReceiver: true
    retention: 2h
    scrapeInterval: 30s
    evaluationInterval: 30s
    podMonitorSelectorNilUsesHelmValues: false
    serviceMonitorSelectorNilUsesHelmValues: false
    resources:
      requests:
        cpu: 500m
        memory: 1Gi
      limits:
        memory: 8Gi
    remoteWrite:
      - url: "${AMP_ENDPOINT}api/v1/remote_write"
        sigv4:
          region: "${AWS_REGION}"
        queueConfig:
          maxSamplesPerSend: 1000
          maxShards: 200
          capacity: 2500

prometheusOperator:
  resources:
    requests:
      cpu: 100m
      memory: 128Mi
    limits:
      memory: 256Mi

kube-state-metrics:
  resources:
    requests:
      cpu: 50m
      memory: 128Mi
    limits:
      memory: 512Mi

grafana:
  enabled: true
  ingress:
    enabled: true
    ingressClassName: alb
    labels:
      guide: ai-eks-docs
    annotations:
      alb.ingress.kubernetes.io/scheme: internet-facing
      alb.ingress.kubernetes.io/target-type: ip
      alb.ingress.kubernetes.io/inbound-cidrs: ${MY_CIDR}
      alb.ingress.kubernetes.io/load-balancer-name: grafana-ai-eks-docs
      alb.ingress.kubernetes.io/healthcheck-path: /api/health
  serviceAccount:
    create: false
    name: grafana-sa
  resources:
    requests:
      cpu: 100m
      memory: 256Mi
    limits:
      memory: 1Gi
  grafana.ini:
    auth.sigv4:
      enabled: true
  sidecar:
    datasources:
      defaultDatasourceEnabled: false
  plugins:
    - grafana-amazonprometheus-datasource
  additionalDataSources:
    - name: Amazon-Managed-Prometheus
      type: grafana-amazonprometheus-datasource
      access: proxy
      url: "${AMP_ENDPOINT}"
      isDefault: true
      jsonData:
        sigV4Auth: true
        defaultRegion: "${AWS_REGION}"
        sigV4Region: "${AWS_REGION}"
      editable: true
  dashboardProviders:
    dashboardproviders.yaml:
      apiVersion: 1
      providers:
        - name: default
          orgId: 1
          folder: 'GPU Monitoring'
          type: file
          disableDeletion: false
          editable: true
          options:
            path: /var/lib/grafana/dashboards/default
  dashboards:
    default:
      nvidia-dcgm:
        gnetId: 25261
        revision: 1
        datasource:
          - name: DS_PROMETHEUS
            value: Amazon-Managed-Prometheus
      vllm:
        gnetId: 25263
        revision: 1
        datasource:
          - name: DS_PROMETHEUS
            value: Amazon-Managed-Prometheus
      vllm-load-analysis:
        gnetId: 25494
        revision: 1
        datasource:
          - name: DS_PROMETHEUS
            value: Amazon-Managed-Prometheus

prometheus-node-exporter:
  resources:
    requests:
      cpu: 50m
      memory: 64Mi
    limits:
      memory: 128Mi
  tolerations:
    - operator: Exists
EOF
Validate the variables were populated correctly:
grep -E "url:|region:" /tmp/kube-prometheus-values.yaml
You should see the full AMP endpoint URL (starting with https://aps-workspaces…) and your Region. If either is empty, re-export the variables and recreate the file.
Install the chart:
helm install kube-prometheus-stack prometheus-community/kube-prometheus-stack \
  --namespace monitoring \
  -f /tmp/kube-prometheus-values.yaml
Verify the pods are running:
kubectl get pods -n monitoring
Expected output:
NAME                                                       READY   STATUS    RESTARTS   AGE
kube-prometheus-stack-grafana-7c58f54f77-rftrj             3/3     Running   0          4m
kube-prometheus-stack-kube-state-metrics-d68dcbc84-5smxq   1/1     Running   0          4m
kube-prometheus-stack-operator-5895df479f-ttm47            1/1     Running   0          4m
kube-prometheus-stack-prometheus-node-exporter-t9q7s       1/1     Running   0          4m
kube-prometheus-stack-prometheus-node-exporter-x6vfb       1/1     Running   0          4m
prometheus-kube-prometheus-stack-prometheus-0              2/2     Running   0          4m
The number of prometheus-node-exporter Pods matches the number of nodes in your cluster, because it runs as a DaemonSet. Expect one more than the preceding output shows if the monitoring workloads caused EKS Auto Mode to launch an additional node.
The stack deploys the following components:
-
Prometheus (StatefulSet): scrapes metrics and remote-writes them to AMP
-
Grafana: dashboards and visualization, pre-configured with the AMP datasource
-
kube-state-metrics: generates metrics about Kubernetes object state (Pod status, resource requests/limits, NodeClaim states)
-
node-exporter (DaemonSet, one per node): collects host-level metrics (CPU, memory, disk, network)
-
operator: manages the Prometheus and Alertmanager custom resources
Alertmanager is disabled in this setup.
Access Grafana
You access Grafana through an internet-facing AWS Application Load Balancer (ALB). You do not create it here. The kube-prometheus-stack chart provisions it from the grafana.ingress configuration in the values file, using the alb
IngressClass from Set up load balancing. The Grafana Helm chart has built-in Ingress support, so no separate manifest is needed. The ALB is named grafana-ai-eks-docs, carries the label guide: ai-eks-docs, and is restricted to the IP address you set in MY_CIDR at install time.
Health check path is required for the Grafana ALB target group
The alb.ingress.kubernetes.io/healthcheck-path annotation in the values file points the load balancer’s health checks at the Grafana /api/health endpoint, which returns 200. Without it, the ALB health checks default to /, which Grafana answers with a 302 redirect to /login, causing the target group to report the endpoint as unhealthy.
Print the load balancer URL. The load balancer is created asynchronously, so allow a minute or two:
echo "http://$(kubectl get ingress kube-prometheus-stack-grafana -n monitoring -o jsonpath='{.status.loadBalancer.ingress[0].hostname}')"
Open the URL in your browser. Log in with username admin and the password from the following command:
kubectl --namespace monitoring get secrets kube-prometheus-stack-grafana -o jsonpath="{.data.admin-password}" | base64 -d ; echo
To verify the metrics pipeline is working end to end:
-
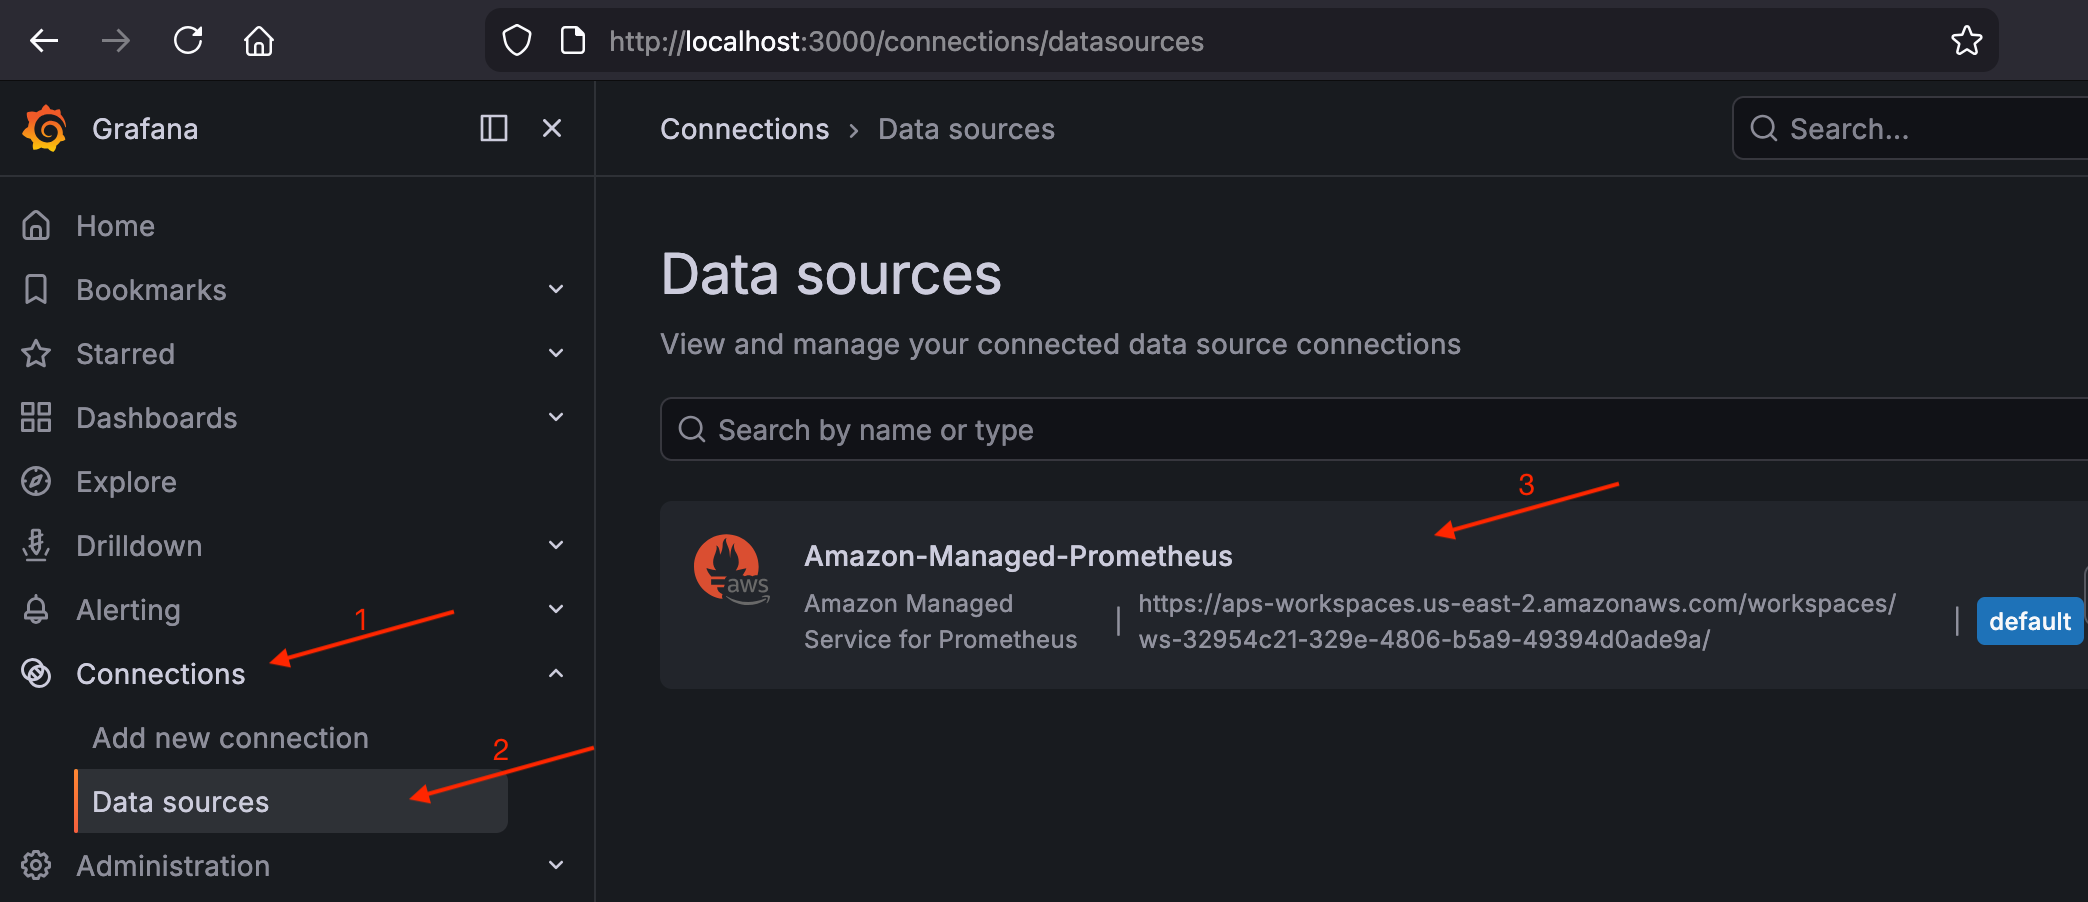
Navigate to Connections > Data sources and confirm
Amazon-Managed-Prometheusis listed as the default datasource.Validate the AMP datasource in Grafana
-
Navigate to Drilldown > Metrics and search for the
upmetric. You should see results from your cluster’s scrape targets.Validate the
upmetric in Grafana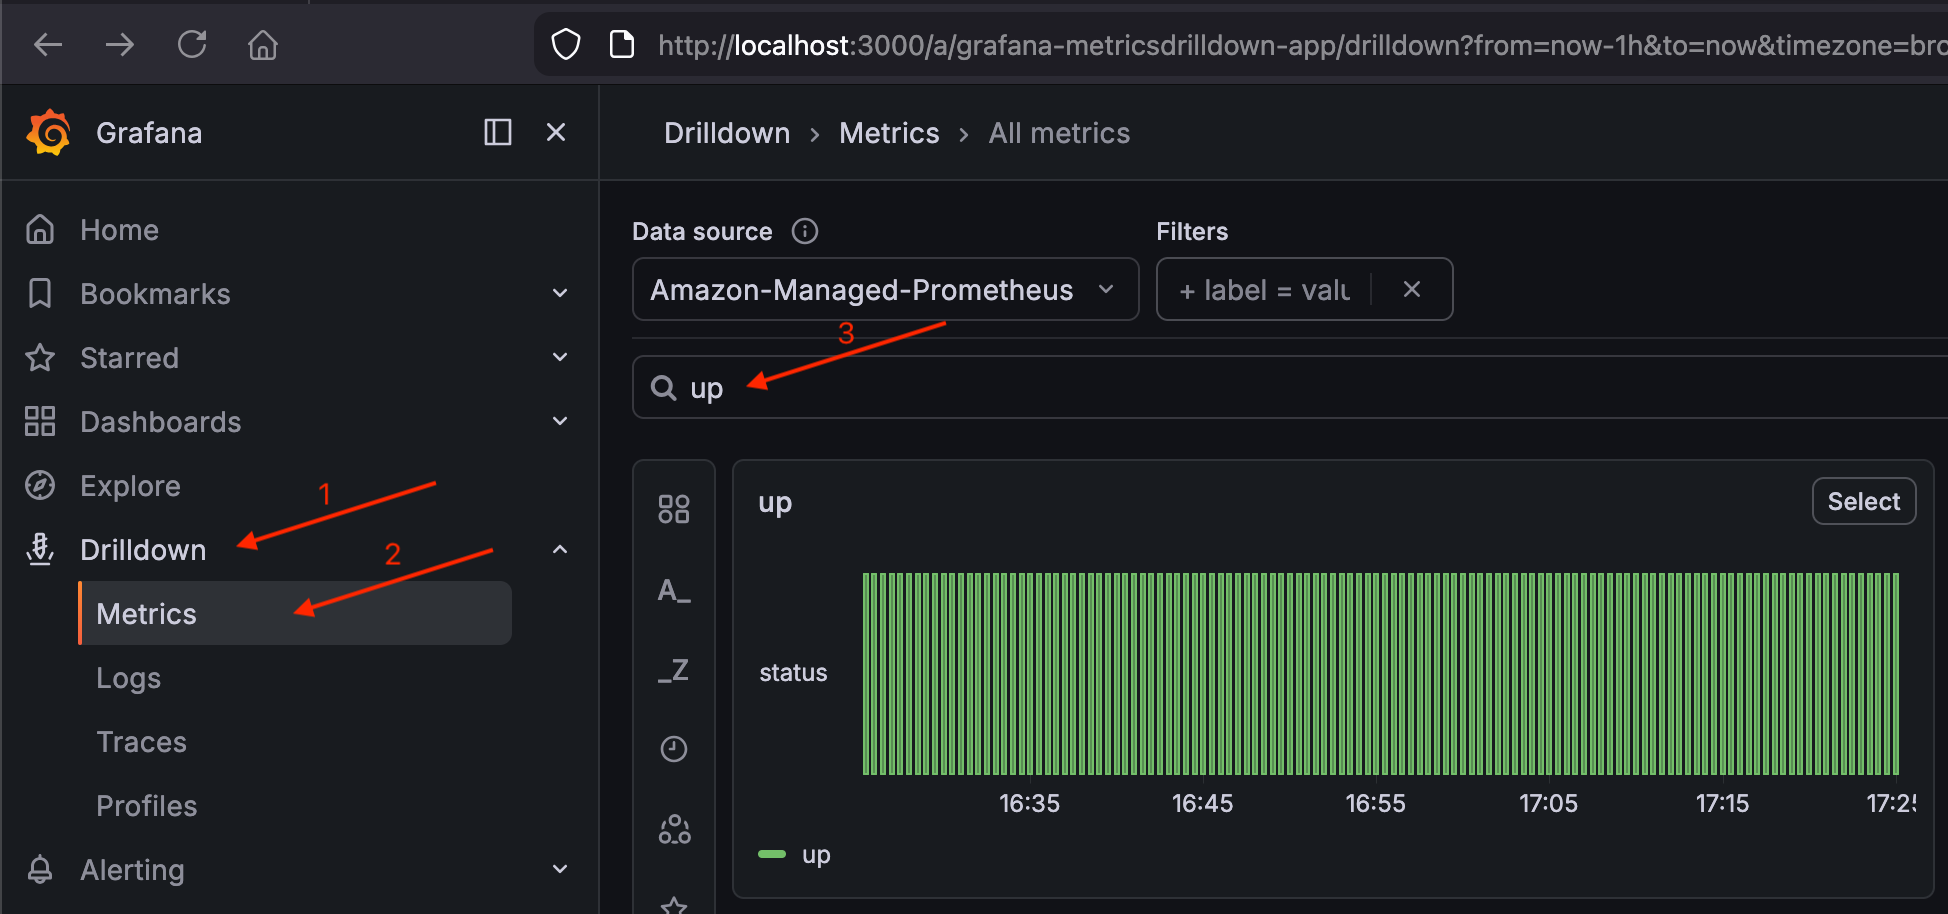
If up shows results, the pipeline (cluster → Prometheus → AMP → Grafana) is working.
Deploy the DCGM Exporter for GPU metrics
The kube-prometheus-stack collects node-level CPU and memory metrics but not GPU metrics. The NVIDIA DCGM Exporter adds GPU utilization, memory usage, temperature, power draw, NVLink bandwidth, and tensor activity.
helm repo add gpu-helm-charts https://nvidia.github.io/dcgm-exporter/helm-charts
helm repo update
Set the GPU node selector key for your path. EKS Auto Mode and self-managed Karpenter use different label keys for GPU manufacturer.
Create the DCGM exporter values file:
Example dcgm-exporter values file
cat << EOF > /tmp/dcgm-exporter-values.yaml
resources:
  requests:
    memory: "512Mi"
    cpu: "100m"
  limits:
    memory: "1Gi"
    cpu: "500m"

serviceMonitor:
  enabled: true
  additionalLabels:
    release: kube-prometheus-stack

nodeSelector:
  ${GPU_NODE_SELECTOR_KEY}: nvidia

tolerations:
  - key: "nvidia.com/gpu"
    operator: "Exists"
    effect: "NoSchedule"

customMetrics: |
  # Clocks
  DCGM_FI_DEV_SM_CLOCK,  gauge, SM clock frequency (in MHz).
  DCGM_FI_DEV_MEM_CLOCK, gauge, Memory clock frequency (in MHz).
  # Temperature
  DCGM_FI_DEV_MEMORY_TEMP, gauge, Memory temperature (in C).
  DCGM_FI_DEV_GPU_TEMP,    gauge, GPU temperature (in C).
  # Power
  DCGM_FI_DEV_POWER_USAGE,              gauge, Power draw (in W).
  DCGM_FI_DEV_TOTAL_ENERGY_CONSUMPTION, counter, Total energy consumption since boot (in mJ).
  # PCIe
  DCGM_FI_PROF_PCIE_TX_BYTES,  counter, Number of bytes transmitted through PCIe TX (in KB) via NVML.
  DCGM_FI_PROF_PCIE_RX_BYTES,  counter, Number of bytes received through PCIe RX (in KB) via NVML.
  DCGM_FI_DEV_PCIE_REPLAY_COUNTER, counter, Total number of PCIe retries.
  # Utilization (the sample period varies depending on the product)
  DCGM_FI_DEV_GPU_UTIL,      gauge, GPU utilization (in %).
  DCGM_FI_DEV_MEM_COPY_UTIL, gauge, Memory utilization (in %).
  DCGM_FI_DEV_ENC_UTIL,      gauge, Encoder utilization (in %).
  DCGM_FI_DEV_DEC_UTIL,      gauge, Decoder utilization (in %).
  # Errors and violations
  DCGM_FI_DEV_XID_ERRORS,            gauge, Value of the last XID error encountered.
  DCGM_EXP_XID_ERRORS_COUNT,         gauge, Value of count of XID errors encountered.
  DCGM_FI_DEV_POWER_VIOLATION,       counter, Throttling duration due to power constraints (in us).
  DCGM_FI_DEV_THERMAL_VIOLATION,     counter, Throttling duration due to thermal constraints (in us).
  DCGM_FI_DEV_SYNC_BOOST_VIOLATION,  counter, Throttling duration due to sync-boost constraints (in us).
  DCGM_FI_DEV_BOARD_LIMIT_VIOLATION, counter, Throttling duration due to board limit constraints (in us).
  DCGM_FI_DEV_LOW_UTIL_VIOLATION,    counter, Throttling duration due to low utilization (in us).
  DCGM_FI_DEV_RELIABILITY_VIOLATION, counter, Throttling duration due to reliability constraints (in us).
  # Memory usage
  DCGM_FI_DEV_FB_FREE, gauge, Framebuffer memory free (in MiB).
  DCGM_FI_DEV_FB_USED, gauge, Framebuffer memory used (in MiB).
  # Retired pages
  DCGM_FI_DEV_RETIRED_SBE,     counter, Total number of retired pages due to single-bit errors.
  DCGM_FI_DEV_RETIRED_DBE,     counter, Total number of retired pages due to double-bit errors.
  DCGM_FI_DEV_RETIRED_PENDING, counter, Total number of pages pending retirement.
  # NVLink
  DCGM_FI_DEV_NVLINK_BANDWIDTH_TOTAL, counter, Total number of NVLink bandwidth counters for all lanes.
  DCGM_FI_PROF_NVLINK_TX_BYTES,       counter, The rate of data transmitted over NVLink not including protocol headers in bytes per second.
  DCGM_FI_PROF_NVLINK_RX_BYTES,       counter, The rate of data received over NVLink not including protocol headers in bytes per second.
  # DCP metrics
  DCGM_FI_PROF_GR_ENGINE_ACTIVE,   gauge, Ratio of time the graphics engine is active (in %).
  DCGM_FI_PROF_SM_ACTIVE,          gauge, The ratio of cycles an SM has at least 1 warp assigned (in %).
  DCGM_FI_PROF_SM_OCCUPANCY,       gauge, The ratio of number of warps resident on an SM (in %).
  DCGM_FI_PROF_PIPE_TENSOR_ACTIVE, gauge, Ratio of cycles the tensor (HMMA) pipe is active (in %).
  DCGM_FI_PROF_DRAM_ACTIVE,        gauge, Ratio of cycles the device memory interface is active sending or receiving data (in %).
  DCGM_FI_DEV_CLOCK_THROTTLE_REASONS, gauge, Current clock throttle reasons (bitmask of DCGM_CLOCKS_THROTTLE_REASON_*).
  DCGM_FI_DEV_GPU_NVLINK_ERRORS,      gauge, Identifies a GPU NVLink error type returned by DCGM_FI_DEV_GPU_NVLINK_ERRORS.
  ## NVLink
  DCGM_FI_DEV_NVLINK_BANDWIDTH_L0, counter, The number of bytes of active NVLink rx or tx data including both header and payload.
  ## Remapped rows
  DCGM_FI_DEV_UNCORRECTABLE_REMAPPED_ROWS, counter, Number of remapped rows for uncorrectable errors.
  DCGM_FI_DEV_CORRECTABLE_REMAPPED_ROWS, counter, Number of remapped rows for correctable errors.
  DCGM_FI_DEV_ROW_REMAP_FAILURE, gauge, whether remapping of rows has failed.
  ## Profiling metrics
  DCGM_FI_PROF_PIPE_FP64_ACTIVE, gauge, Ratio of cycles the fp64 pipes are active (in %).
  DCGM_FI_PROF_PIPE_FP32_ACTIVE, gauge, Ratio of cycles the fp32 pipes are active (in %).
  DCGM_FI_PROF_PIPE_FP16_ACTIVE, gauge, Ratio of cycles the fp16 pipes are active (in %).
  # ECC
  DCGM_FI_DEV_ECC_SBE_VOL_TOTAL, counter, Total number of single-bit volatile ECC errors.
  DCGM_FI_DEV_ECC_DBE_VOL_TOTAL, counter, Total number of double-bit volatile ECC errors.
EOF
The customMetrics field overrides the DCGM exporter’s default metric set with an extended one that includes NVLink bandwidth, tensor activity, PCIe throughput, ECC errors, and thermal throttling. For inference workloads these help you understand whether the GPU compute units are fully utilized, whether the GPU is idle between requests because of low batch sizes, whether data transfer between CPU and GPU is a bottleneck, whether thermal throttling is causing latency spikes, and how much GPU memory headroom remains for larger batches.
Note
The metric list covers GPUs across instance families, so it includes metrics that a given GPU does not expose. Once the exporter runs on a GPU node, its logs report each one it skips with a metric not enabled warning:
level=WARN msg="Skipping line 27 ('DCGM_FI_PROF_NVLINK_TX_BYTES'): metric not enabled"
For example, an NVIDIA L4 GPU on a G6 instance has no NVLink, so the NVLink metrics are skipped. These warnings are expected and the remaining metrics are still collected.
Install the DCGM exporter:
helm install dcgm-exporter gpu-helm-charts/dcgm-exporter \
  --namespace monitoring \
  -f /tmp/dcgm-exporter-values.yaml
The tolerations allow the exporter to run on the GPU-tainted nodes provisioned by the GPU NodePool you create in the Create a GPU NodePool for AI/ML inference section. The serviceMonitor with the release: kube-prometheus-stack label ensures Prometheus discovers and scrapes it automatically.
Verify the DCGM exporter DaemonSet. Because the exporter selects GPU nodes and none exist yet, the expectation is that there are zero DCGM exporter Pods:
kubectl get daemonset dcgm-exporter -n monitoring
Expected output:
NAME            DESIRED   CURRENT   READY   UP-TO-DATE   AVAILABLE   NODE SELECTOR                                        AGE
dcgm-exporter   0         0         0       0            0           eks.amazonaws.com/instance-gpu-manufacturer=nvidia   30s
On the self-managed Karpenter path, the NODE SELECTOR column shows karpenter.k8s.aws/instance-gpu-manufacturer=nvidia instead.
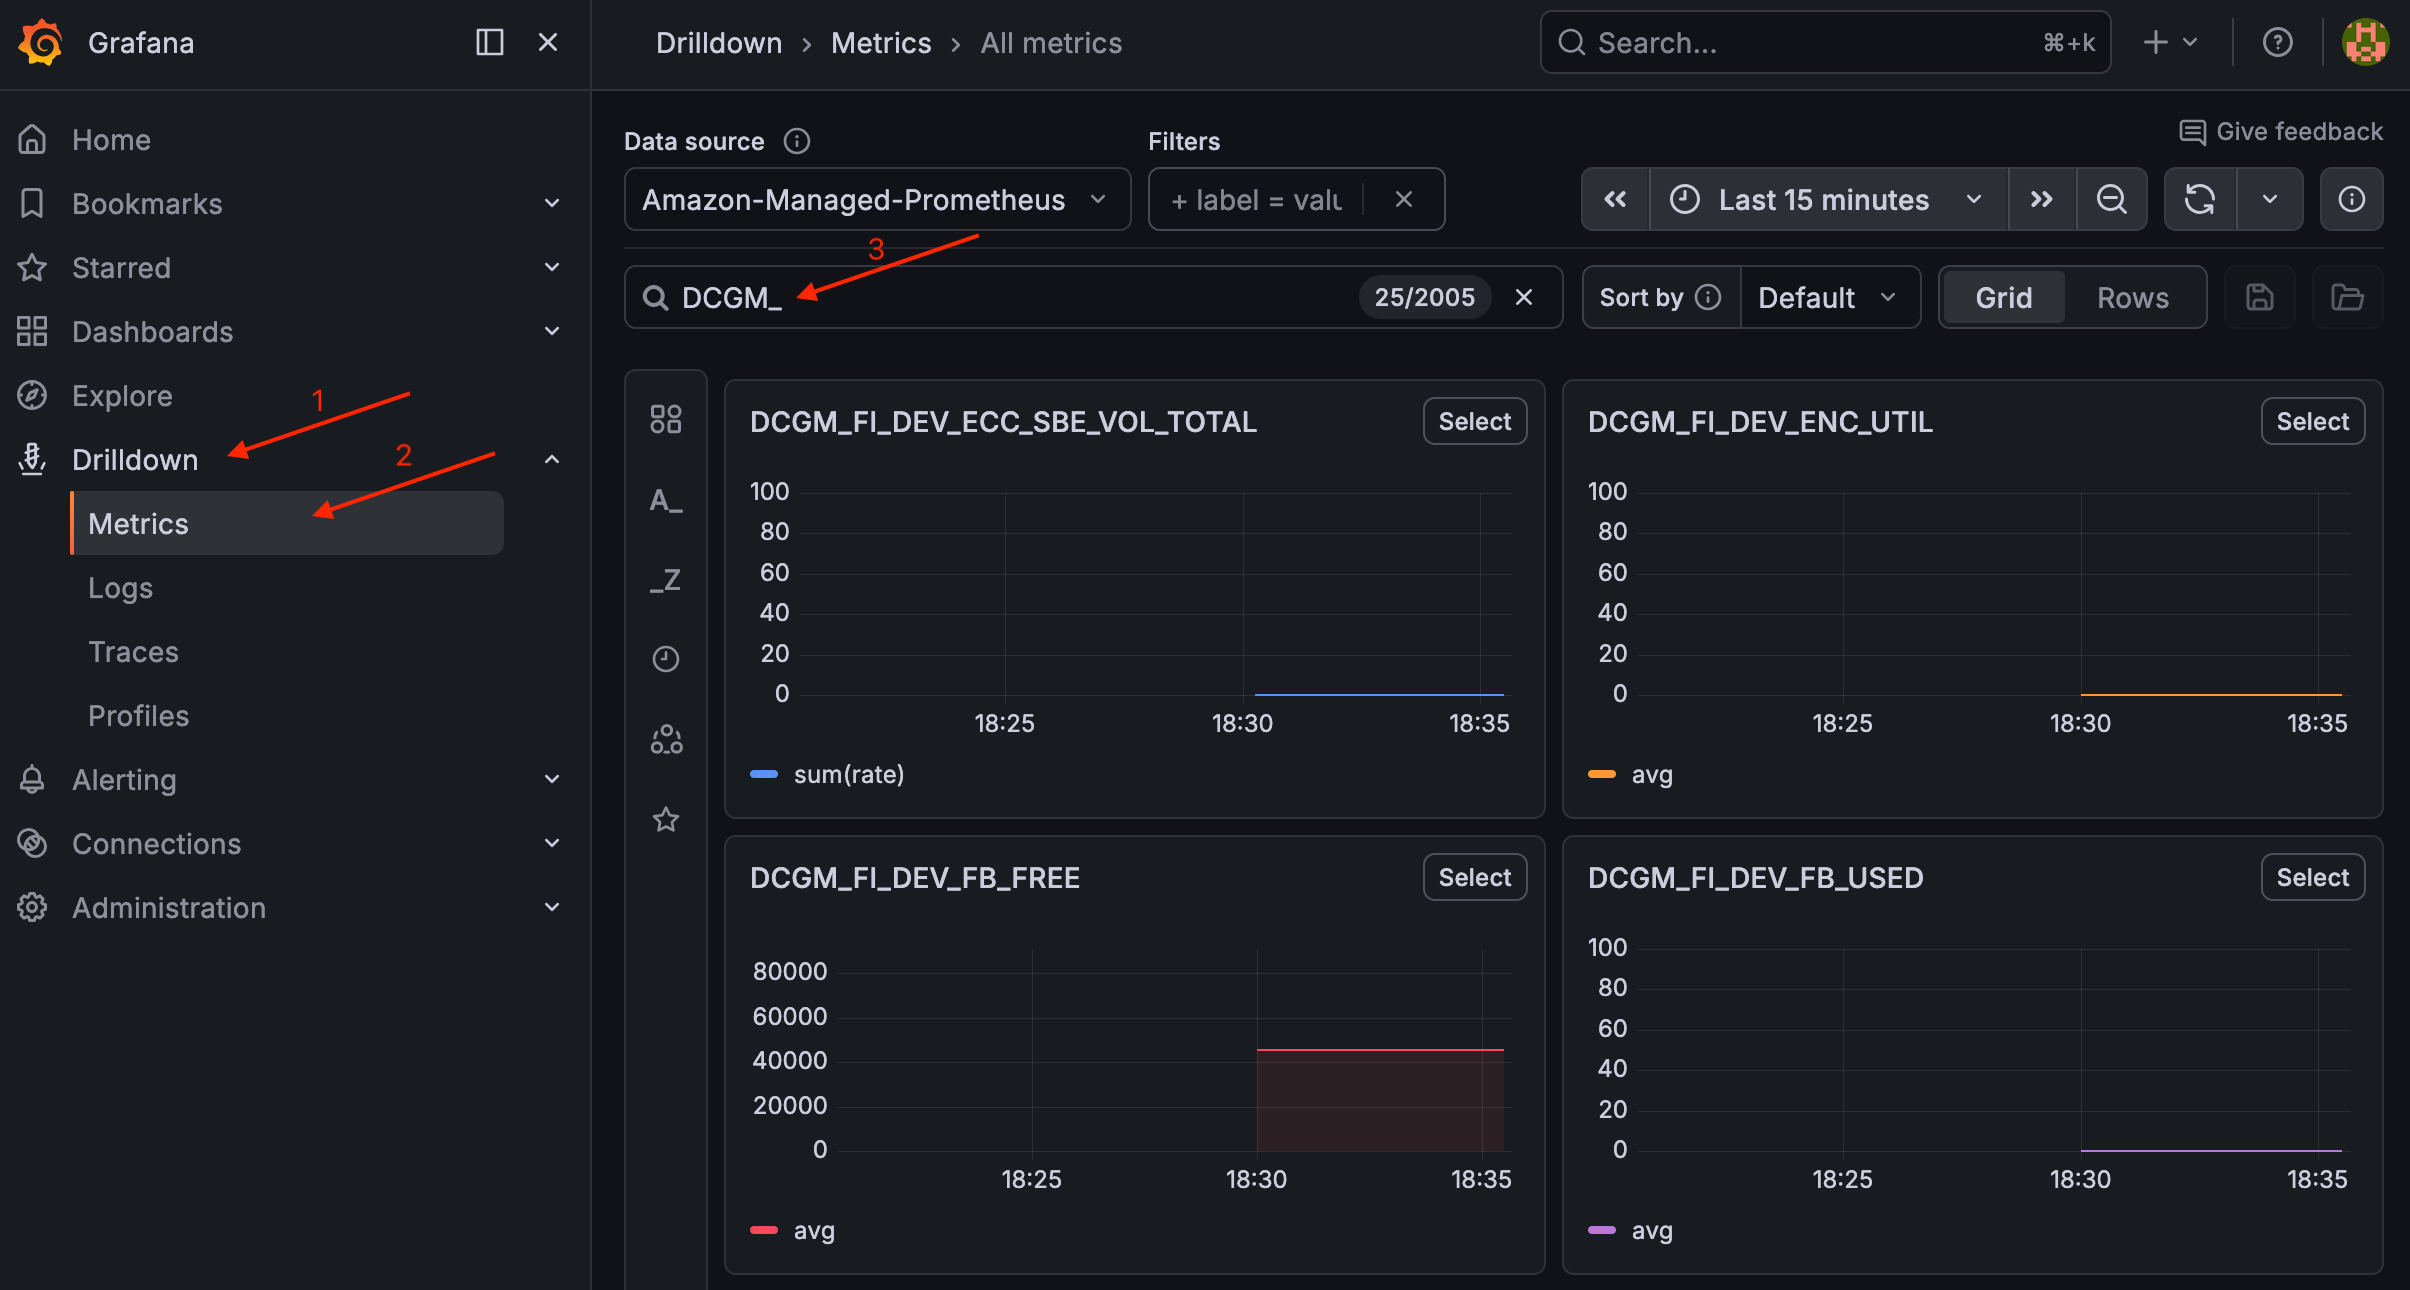
After you create the GPU NodePool in the Create a GPU NodePool for AI/ML inference section and a GPU node joins the cluster, the DaemonSet schedules one Pod onto that node automatically. You can then validate DCGM metrics by navigating to Drilldown > Metrics in Grafana and searching for DCGM_. The search returns the GPU metrics the exporter collects, including DCGM_FI_DEV_ECC_SBE_VOL_TOTAL for single-bit ECC errors, DCGM_FI_DEV_ENC_UTIL for encoder utilization, and DCGM_FI_DEV_FB_FREE and DCGM_FI_DEV_FB_USED for free and used framebuffer memory. Any results mean Prometheus is scraping the exporter and writing to Amazon Managed Service for Prometheus.
Validate DCGM metrics in Grafana
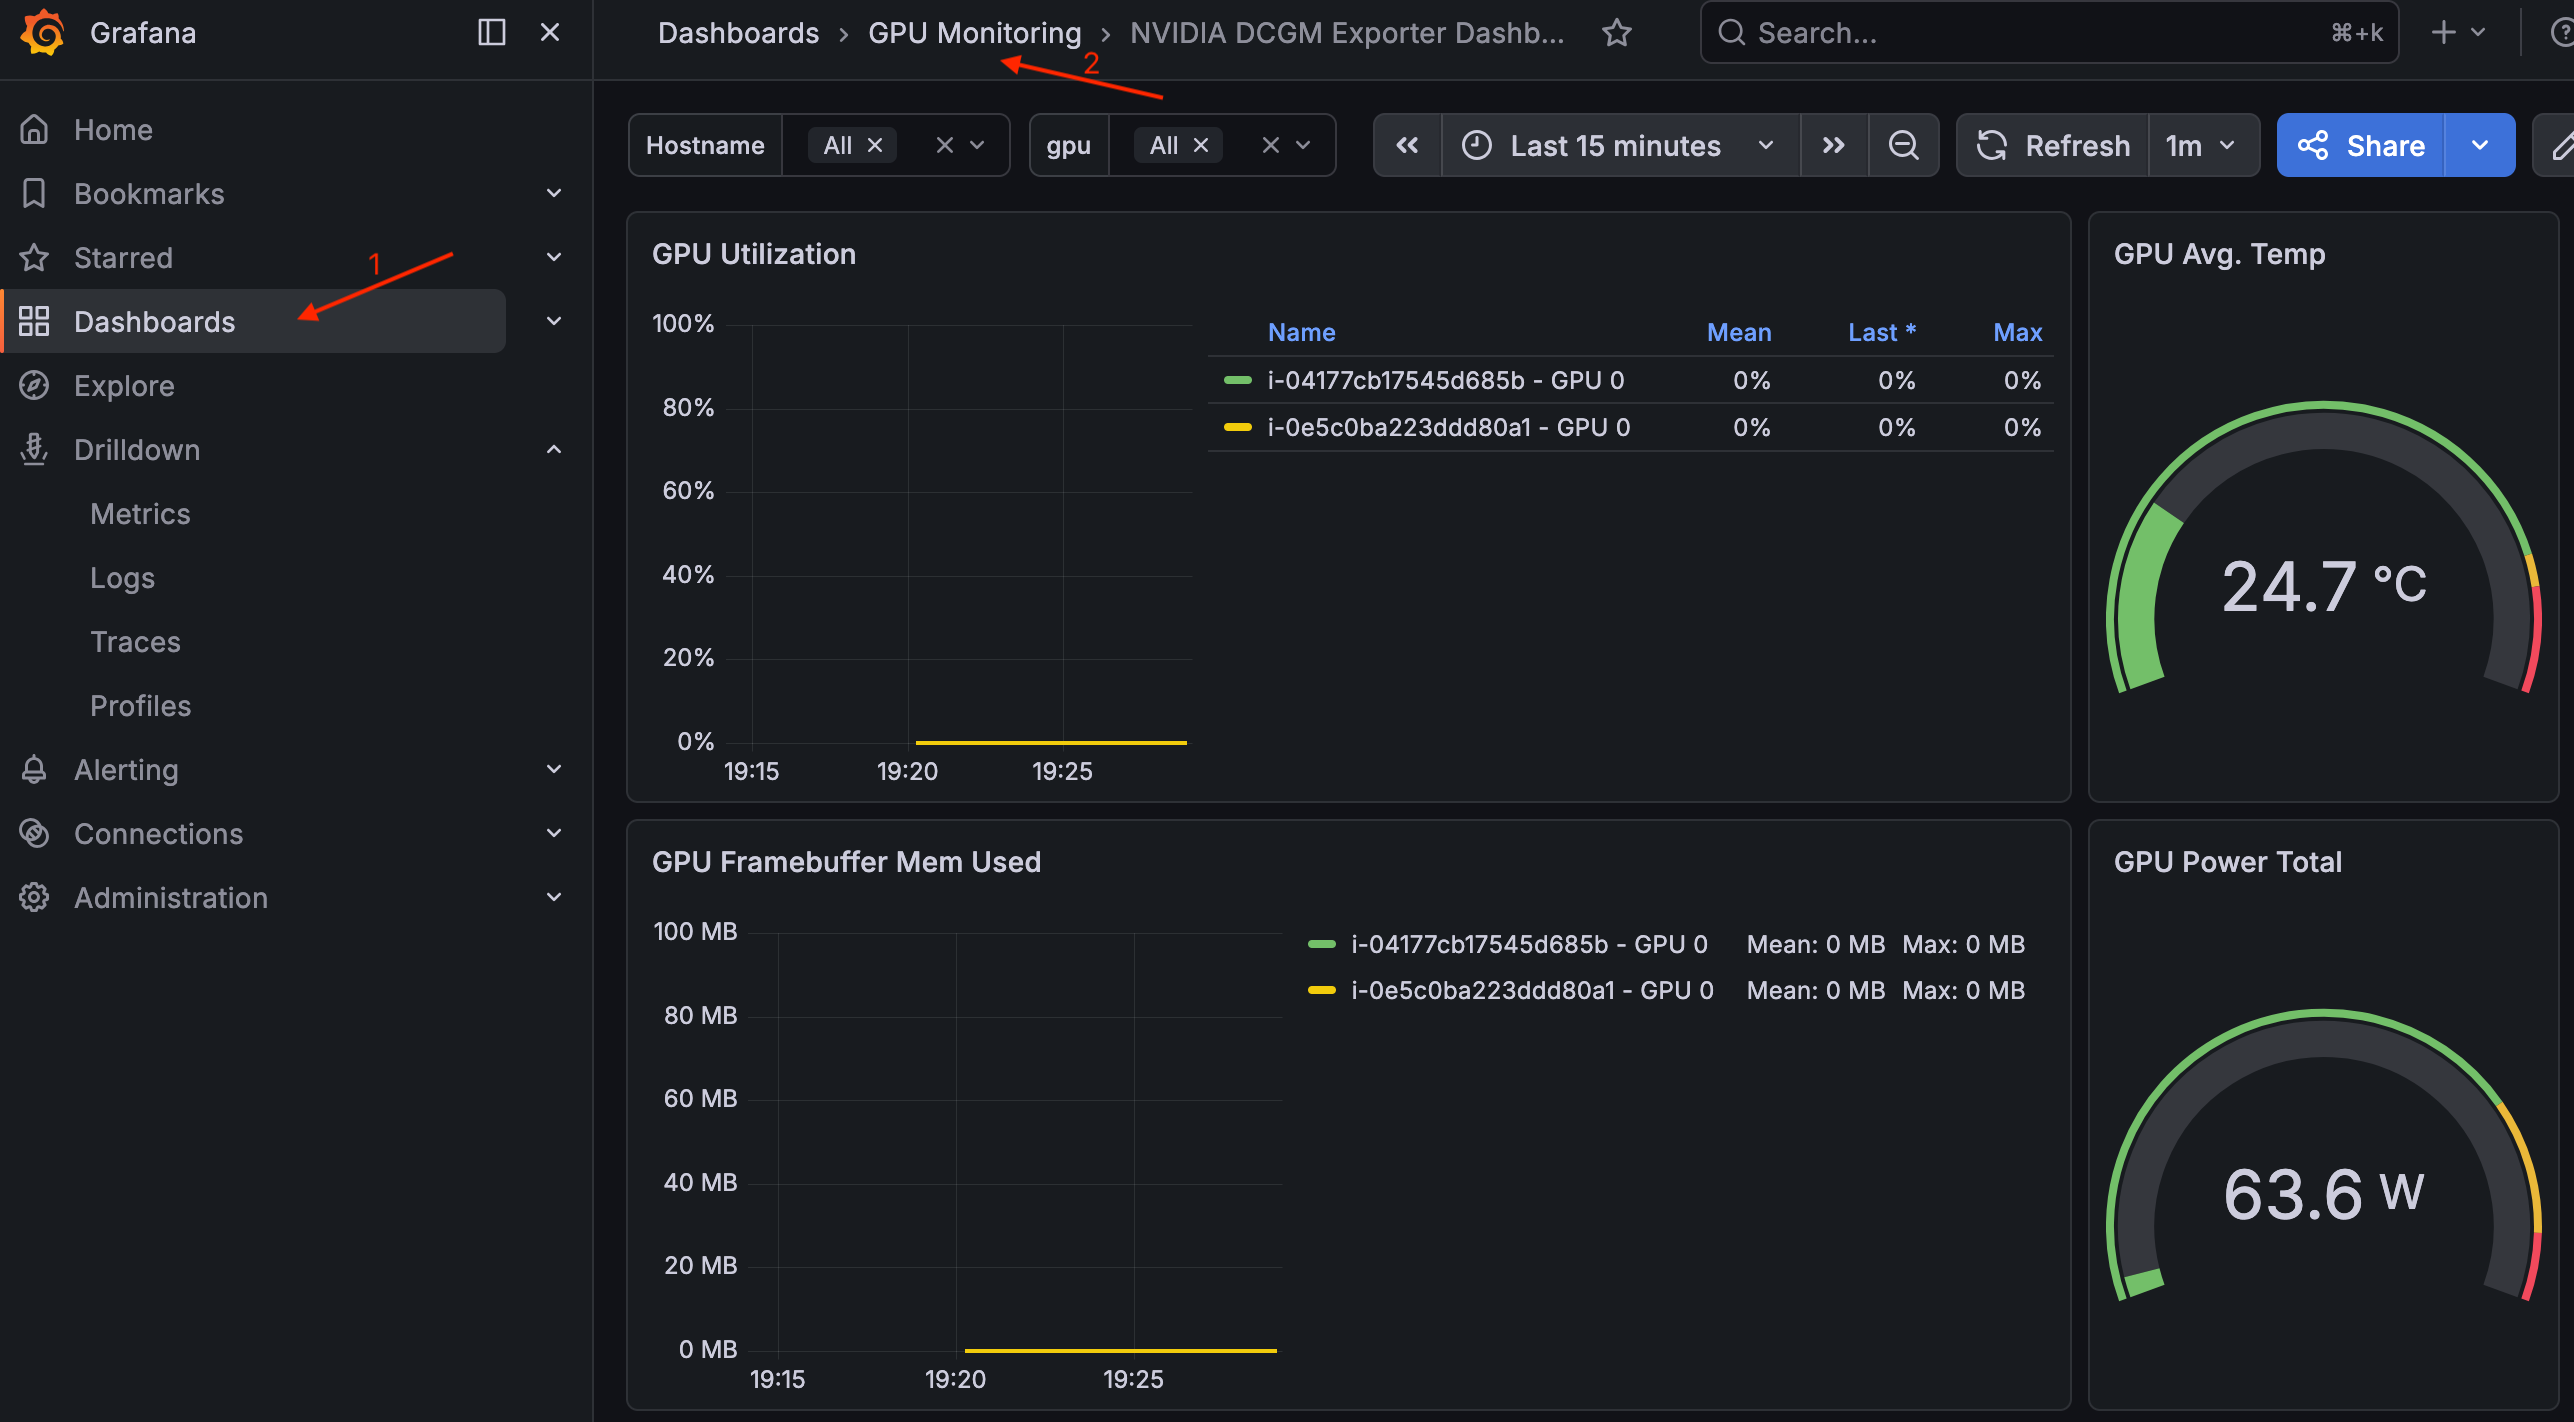
Once GPU nodes are running, the pre-provisioned GPU dashboard is also populated. To view it, navigate to Dashboards > GPU Monitoring > NVIDIA DCGM Exporter Dashboard. The dashboard has panels for GPU Utilization, GPU Avg Temp, GPU Framebuffer Mem Used, and GPU Power Total. Non-zero values in those panels confirm the full path is working, from the exporter on the GPU node through Prometheus to Amazon Managed Service for Prometheus. An idle GPU node reports 0% utilization and 0 MiB framebuffer memory used, but still reports a temperature and power draw.
NVIDIA DCGM Exporter Dashboard in Grafana
Step 4: Create S3 bucket for model weights
Create an Amazon S3 bucket for storing model weights and configure an EKS Pod Identity Association so workload pods can read and write to it.
If you opened a new terminal, set the cluster name and region:
export CLUSTER_NAME=ai-eks-docs
export AWS_REGION=us-east-2
Create the S3 bucket
Create the bucket with a random suffix to avoid name collisions:
BUCKET_SUFFIX=$(head -c 4 /dev/urandom | od -An -tx1 | tr -d ' \n')
MODEL_BUCKET="${CLUSTER_NAME}-models-${BUCKET_SUFFIX}"

aws s3 mb s3://${MODEL_BUCKET} --region ${AWS_REGION}
S3 buckets created after January 2023 have server-side encryption (AES256) and public access blocking enabled by default.
Configure EKS Pod Identity for S3 access
Create a model-storage-sa ServiceAccount in the default namespace, an IAM policy scoped to the model bucket, and an EKS Pod Identity Association that links them. Workload pods that set serviceAccountName: model-storage-sa will be able to read and write to the bucket.
kubectl create serviceaccount model-storage-sa
Create the IAM policy:
POLICY_ARN=$(aws iam create-policy \
  --policy-name "${CLUSTER_NAME}-model-storage-policy" \
  --policy-document "{\"Version\": \"2012-10-17\", \"Statement\": [{\"Effect\": \"Allow\", \"Action\": [\"s3:GetObject\", \"s3:PutObject\", \"s3:ListBucket\", \"s3:DeleteObject\"], \"Resource\": [\"arn:aws:s3:::${MODEL_BUCKET}\", \"arn:aws:s3:::${MODEL_BUCKET}/*\"]}]}" \
  --query 'Policy.Arn' \
  --output text)

echo "Policy ARN: ${POLICY_ARN}"
Note
This policy grants s3:DeleteObject and s3:PutObject for the validation step. For production inference pods that only read model weights, remove s3:PutObject and s3:DeleteObject to follow least-privilege.
Create the EKS Pod Identity Association. eksctl creates the IAM role with the correct trust policy and links it to the ServiceAccount:
eksctl create podidentityassociation \
  --cluster ${CLUSTER_NAME} \
  --namespace default \
  --service-account-name model-storage-sa \
  --role-name "${CLUSTER_NAME}-model-storage-role" \
  --permission-policy-arns ${POLICY_ARN} \
  --region ${AWS_REGION}
Verify the association:
eksctl get podidentityassociation --cluster ${CLUSTER_NAME} --region ${AWS_REGION}
The output should include the model-storage-sa association in the default namespace.
Run a one-off Pod with the AWS CLI image, using the model-storage-sa ServiceAccount, to confirm EKS Pod Identity is wired up and S3 access works:
cat << EOF | kubectl apply -f -
apiVersion: v1
kind: Pod
metadata:
  name: s3-test
  labels:
    guide: ai-eks-docs
spec:
  serviceAccountName: model-storage-sa
  containers:
    - name: aws-cli
      image: public.ecr.aws/aws-cli/aws-cli:2.27.0
      command:
        - sh
        - -c
        - |
          echo "=== Caller Identity ==="
          aws sts get-caller-identity
          echo ""
          echo "=== S3 Write Test ==="
          echo "pod identity works" | aws s3 cp - s3://${MODEL_BUCKET}/test.txt
          echo ""
          echo "=== S3 List Test ==="
          aws s3 ls s3://${MODEL_BUCKET}/
          echo ""
          echo "=== S3 Delete Test ==="
          aws s3 rm s3://${MODEL_BUCKET}/test.txt
  restartPolicy: Never
EOF
Wait for the Pod to complete and check the logs:
kubectl wait --for=jsonpath='{.status.phase}'=Succeeded pod/s3-test --timeout=300s
kubectl logs s3-test
Expected output:
=== Caller Identity ===
{
    "UserId": "AROA...:eks-ai-eks-doc-s3-test-...",
    "Account": "123456789012",
    "Arn": "arn:aws:sts::123456789012:assumed-role/ai-eks-docs-model-storage-role/eks-ai-eks-doc-s3-test-..."
}

=== S3 Write Test ===

=== S3 List Test ===
2026-05-04 12:00:00         19 test.txt

=== S3 Delete Test ===
delete: s3://ai-eks-docs-models-01234567/test.txt
The caller identity confirms the Pod assumed the ${CLUSTER_NAME}-model-storage-role role through EKS Pod Identity. The S3 commands confirm read and write access. The write test prints no output of its own, because the AWS CLI suppresses its upload: progress line when the source is standard input; the object listed by the next command is the proof that the write succeeded.
Clean up the test Pod:
kubectl delete pod s3-test
Next steps
With your cluster ready, continue to Create a GPU NodePool for AI/ML inference, in the Run AI/ML inference workloads on Amazon EKS section, to create a GPU NodePool that dynamically provisions GPU-enabled nodes for your workloads.
Cleanup
Tip
If you plan to continue with the next sections of this guide, skip the full cleanup. Only run it when you are done.
Important
If you created a GPU NodePool, run Clean up the GPU NodePool first. Deleting the cluster does not cancel an On-Demand Capacity Reservation (ODCR), which keeps billing until you cancel it explicitly.
export CLUSTER_NAME=ai-eks-docs
export AWS_REGION=us-east-2
Look up the IAM policy ARN:
AMP_POLICY_ARN=$(aws iam list-policies \
  --scope Local \
  --query "Policies[?PolicyName=='${CLUSTER_NAME}-amp-grafana-policy'].Arn" \
  --output text)
echo "AMP Policy ARN: ${AMP_POLICY_ARN}"
Look up the AMP workspace ID:
AMP_WORKSPACE_ID=$(aws amp list-workspaces \
  --alias "amp-ws-${CLUSTER_NAME}" \
  --query 'workspaces[0].workspaceId' \
  --output text \
  --region ${AWS_REGION})
echo "AMP Workspace ID: ${AMP_WORKSPACE_ID}"
Uninstall the DCGM exporter Helm release:
helm uninstall dcgm-exporter -n monitoring
Uninstall the kube-prometheus-stack Helm release:
helm uninstall kube-prometheus-stack -n monitoring
Delete the EKS Pod Identity association for the Prometheus ingest service account:
eksctl delete podidentityassociation \
  --cluster ${CLUSTER_NAME} \
  --namespace monitoring \
  --service-account-name amp-iamproxy-ingest-service-account \
  --region ${AWS_REGION}
Delete the EKS Pod Identity association for the Grafana service account:
eksctl delete podidentityassociation \
  --cluster ${CLUSTER_NAME} \
  --namespace monitoring \
  --service-account-name grafana-sa \
  --region ${AWS_REGION}
Delete the IAM policy used by Prometheus and Grafana:
aws iam delete-policy --policy-arn ${AMP_POLICY_ARN}
Delete the AMP workspace:
aws amp delete-workspace --workspace-id ${AMP_WORKSPACE_ID} --region ${AWS_REGION}
Delete the monitoring namespace:
kubectl delete namespace monitoring
Look up the model bucket name:
MODEL_BUCKET=$(aws s3api list-buckets \
  --query "Buckets[?starts_with(Name, '${CLUSTER_NAME}-models-')].Name | [0]" \
  --output text)
echo "Model bucket: ${MODEL_BUCKET}"
Look up the IAM policy ARN:
POLICY_ARN=$(aws iam list-policies \
  --scope Local \
  --query "Policies[?PolicyName=='${CLUSTER_NAME}-model-storage-policy'].Arn" \
  --output text)
echo "Policy ARN: ${POLICY_ARN}"
Delete the S3 model bucket and all of its objects:
aws s3 rb s3://${MODEL_BUCKET} --force
Delete the EKS Pod Identity association:
eksctl delete podidentityassociation \
  --cluster ${CLUSTER_NAME} \
  --namespace default \
  --service-account-name model-storage-sa \
  --region ${AWS_REGION}
Delete the IAM policy:
aws iam delete-policy --policy-arn ${POLICY_ARN}
Delete the Kubernetes ServiceAccount:
kubectl delete serviceaccount model-storage-sa
On the self-managed Karpenter path, first delete every Karpenter NodePool and EC2NodeClass, including the general-purpose pair from Step 1. Then wait for the nodes to drain.
Karpenter creates an EC2 instance profile for each EC2NodeClass and removes it when you delete that EC2NodeClass. If an EC2NodeClass still exists when eksctl removes Karpenter, nothing is left to delete the instance profile. The stack that owns the Karpenter node IAM role then cannot be deleted:
kubectl delete nodepool --all
kubectl delete ec2nodeclass --all
kubectl get nodeclaims
Wait until kubectl get nodeclaims returns No resources found, then delete the cluster:
eksctl delete cluster --name=$CLUSTER_NAME --region=$AWS_REGION
eksctl deletes the cluster AWS CloudFormation stack asynchronously. The command prints all cluster resources were deleted and returns before deletion finishes, so wait a few minutes and then confirm the cluster, its nodes, and its stack are gone:
aws eks list-clusters --region $AWS_REGION

aws ec2 describe-instances \
  --region $AWS_REGION \
  --filters "Name=tag:eks:cluster-name,Values=${CLUSTER_NAME}" \
            "Name=instance-state-name,Values=pending,running,stopping,stopped" \
  --query 'Reservations[].Instances[].InstanceId' \
  --output text

aws cloudformation describe-stacks \
  --region $AWS_REGION \
  --stack-name eksctl-${CLUSTER_NAME}-cluster \
  --query 'Stacks[0].StackStatus' \
  --output text
The cluster name should be absent from the first command’s output, the second command should return nothing, and the third should report that the stack does not exist.
If a stack reports DELETE_FAILED, list the resources that blocked deletion, remove them, and delete the stack again. The following command prints the reason for each failure, for either of the two stacks that can fail here:
aws cloudformation describe-stack-events \
  --region $AWS_REGION \
  --stack-name [.replaceable]`stack-name` \
  --query "StackEvents[?ResourceStatus=='DELETE_FAILED'].[LogicalResourceId,ResourceStatusReason]" \
  --output text
Two failures are common on the self-managed Karpenter path:
-
eksctl-fails withcluster-name-karpenterKarpenterNodeRole … Cannot delete entity, must remove roles from instance profile first. An instance profile that Karpenter created still references the node role, which happens when anEC2NodeClassoutlived Karpenter. Detach and delete the instance profile, then delete the stack again:aws iam list-instance-profiles-for-role \ --role-name eksctl-KarpenterNodeRole-${CLUSTER_NAME} \ --query 'InstanceProfiles[].InstanceProfileName' \ --output text aws iam remove-role-from-instance-profile \ --instance-profile-name [.replaceable]`instance-profile-name` \ --role-name eksctl-KarpenterNodeRole-${CLUSTER_NAME} aws iam delete-instance-profile --instance-profile-name [.replaceable]`instance-profile-name` aws cloudformation delete-stack --region $AWS_REGION --stack-name eksctl-${CLUSTER_NAME}-karpenter -
eksctl-fails oncluster-name-clusterControlPlaneSecurityGroup,ClusterSharedNodeSecurityGroup, or the private subnets. Each reports a dependent object error. The EKS-managed cluster security groupeks-cluster-sg-can outlive the control plane and hold the subnets. Confirm no network interfaces remain in the VPC, delete that security group, and delete the stack again:cluster-name-*aws ec2 describe-security-groups \ --region $AWS_REGION \ --filters "Name=group-name,Values=eks-cluster-sg-${CLUSTER_NAME}-*" \ --query 'SecurityGroups[].[GroupId,VpcId]' \ --output text aws ec2 describe-network-interfaces \ --region $AWS_REGION \ --filters "Name=vpc-id,Values=[.replaceable]`vpc-id`" \ --query 'NetworkInterfaces[].NetworkInterfaceId' \ --output text aws ec2 delete-security-group --region $AWS_REGION --group-id [.replaceable]`sg-id` aws cloudformation delete-stack --region $AWS_REGION --stack-name eksctl-${CLUSTER_NAME}-clusterDeletion can take several more minutes after you remove the blocking resource, because AWS CloudFormation retries the dependent subnets and security groups.