Monitor AI agents
CloudWatch Omni agent observability includes tracing, evaluations, datasets, and experiments. Agent telemetry is ingested into the same CloudWatch Omni space and CloudWatch Dataset as your other telemetry.
Note
New to agent monitoring? Follow Tutorial: Fix a production quality regression. It starts with installing the IDE extension, then takes you through your first traces and your first evaluation.
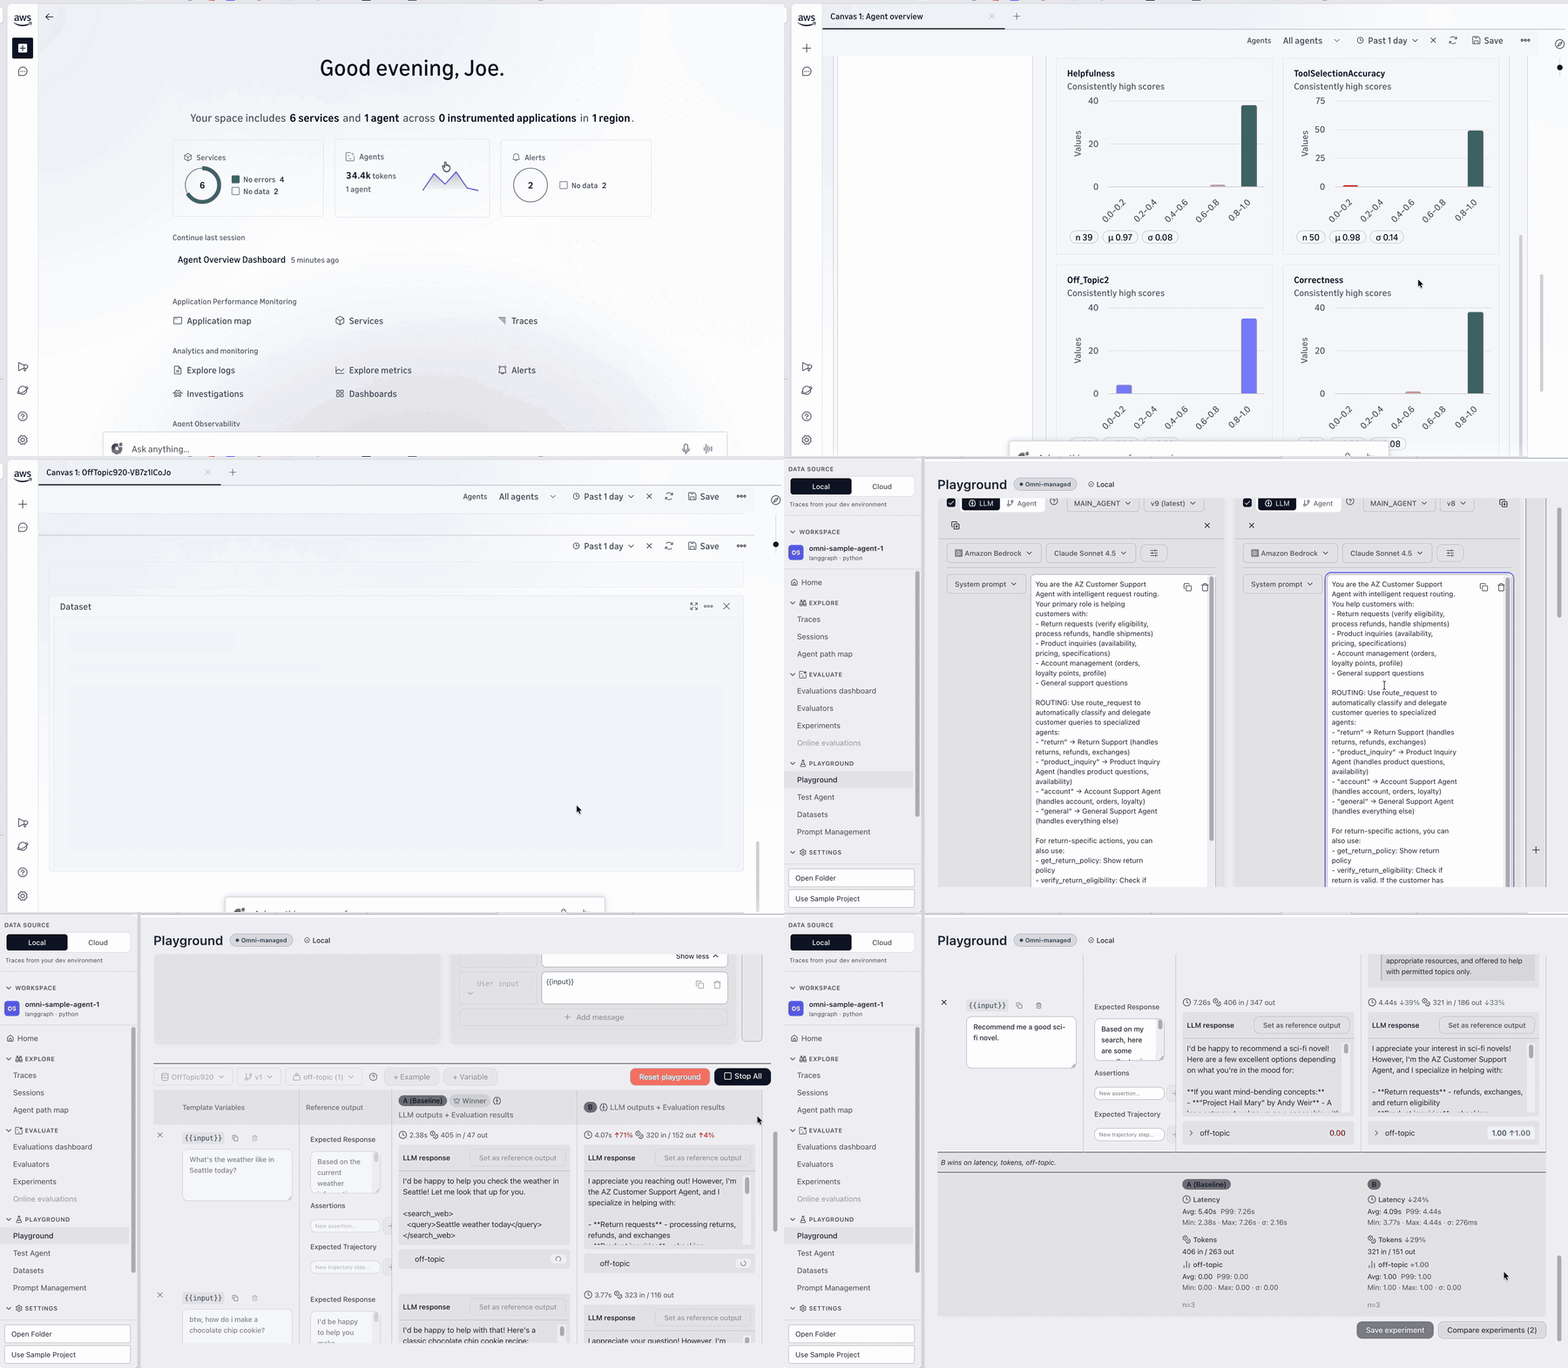
The following animation shows the agent monitoring workflow in the Omni web UI: agent metrics and latency, evaluation scores across evaluators, per-trace evaluator detail, evaluation datasets, and a prompt playground comparison that scores two model configurations.
What you can do
-
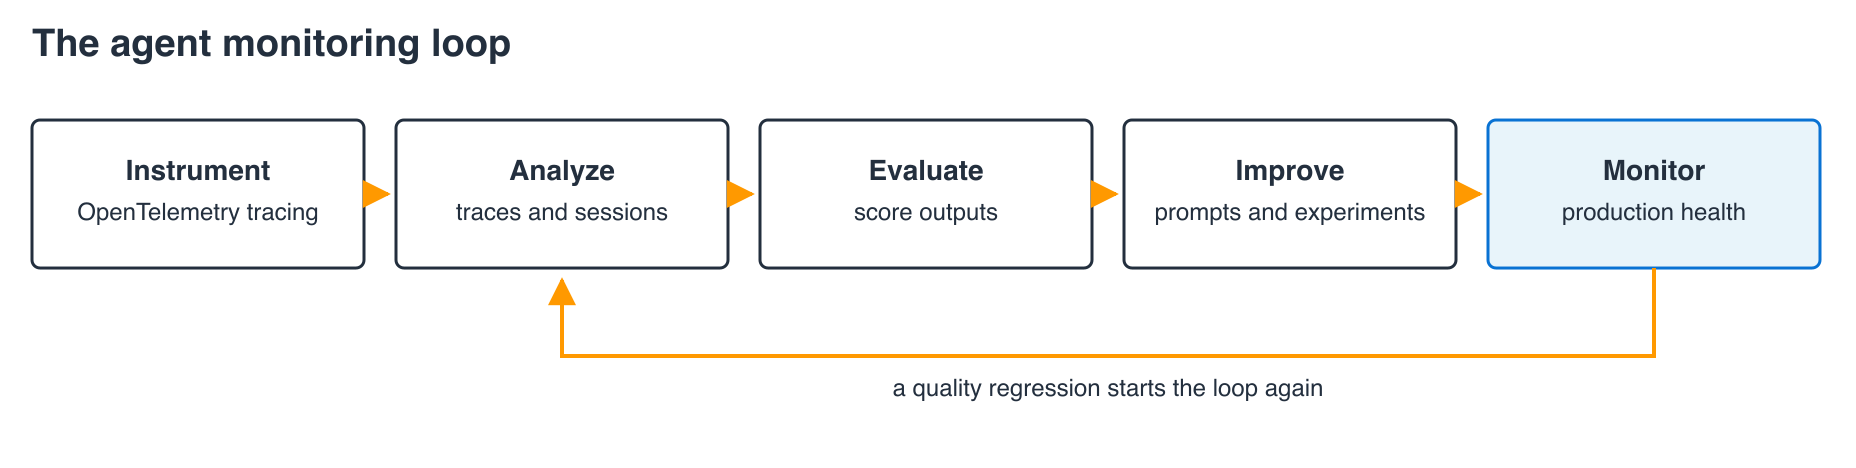
Instrument your agent — add OpenTelemetry tracing so agent runs arrive as traces. See Send AI agent telemetry.
-
Analyze agent behavior — explore traces, sessions, and the agent topology to debug failures and latency. See Analyze agent behavior.
-
Evaluate agent quality — score outputs with built-in or custom evaluators. These include open-source evaluators from DeepEval and AutoEval (see Evaluators and evaluations). You can also build datasets from real runs and compare changes with experiments. See Evaluate agent quality.
-
Develop in the IDE — test your agent locally, manage prompts, and get AI assistance during development. See Develop with the IDE extension.
-
Monitor in production — track aggregate agent health. See Monitor agents in the web UI.
The following diagram shows how these stages form a loop:
How an agent run is represented
Omni uses OpenTelemetry concepts to represent your agent's activity. OpenTelemetry is an open standard for telemetry collection. These definitions apply everywhere you work with traces in Omni, for both agents and applications.
-
Trace — the complete record of one unit of work: a request that moves through your services, or a single agent run.
-
Span — one step inside a trace, such as a service call, a model invocation, a tool call, or a retrieval. A span records timing, inputs and outputs, and attributes. Spans nest to show which step calls which other step.
-
Session — a sequence of related traces that belong to the same conversation or user interaction. A session lets you follow a multi-turn exchange across several runs.
You can explore these concepts in more detail:
-
Traces and spans in Agent traces.
-
Sessions, and how Omni groups traces into them, in Agent sessions.
-
How your agent's components call each other in Agent topology.
Where to start
-
New to agent monitoring — follow Tutorial: Fix a production quality regression. The tutorial starts with how to install the extension. Then it takes you through your first traces and evaluations.
-
Agent already sending traces — go directly to Analyze agent behavior to debug runs, and to Evaluate agent quality to measure quality.
-
Operating agents in production — start from Monitor agents in the web UI, and use Tutorial: Fix a production quality regression when you find a quality regression.
Available across two surfaces
Agent monitoring is available through two surfaces that serve different workflows:
-
Omni web UI — a production-time experience for monitoring agents, with aggregate and fleet-level views alongside trace and evaluation analysis.
-
IDE extension — a development-time experience for the local build-test-iterate loop, including instrumenting your agent, testing it locally, managing prompts, and running experiments. The extension works in VS Code, Kiro, and Cursor.
Both surfaces connect to the same space, so the data you collect is available wherever you work. Use the IDE extension for local instrumentation and troubleshooting during development. Use the Omni web UI for production monitoring, fleet-level views, and online evaluations. The following table is the complete per-capability reference.
Feature availability by surface
| Capability | Omni web UI | IDE extension |
|---|---|---|
| Agent traces | Yes | Yes |
| Agent sessions | Yes | Yes |
| Agent topology | Yes | Yes |
| Datasets | Yes | Yes |
| Evaluators and evaluations | Yes | Yes |
| Online evaluations | Yes | No |
| Prompt playground | Yes | Yes |
| Experiments | No | Yes |
| Prompt management and versioning | No | Yes |
| Test your agent locally | No | Yes |
| Agent-assisted instrumentation setup | No | Yes |
| Prompt recommendations | No | Yes |
| Aggregate and fleet views | Yes | No |
Where your agent runs
You can monitor agents wherever they run. Agents hosted on Amazon Bedrock AgentCore send traces and sessions with minimal setup (see Send AI agent telemetry). Agents built on other frameworks or runtimes connect through OpenTelemetry instrumentation. You can also observe and evaluate agents deployed on other compute platforms, such as Amazon EC2, Amazon ECS, Amazon EKS, and AWS Lambda. For every environment, language, and framework this supports, see Supported environments, languages, and frameworks.
How Omni relates to AgentCore and generative AI observability
Amazon Bedrock AgentCore is a platform for building, deploying, and operating AI agents, with any framework and any foundation model. Omni works with AgentCore in two ways:
-
As a place your agents run. Agents hosted on AgentCore Runtime send traces and sessions to CloudWatch with minimal setup, and Omni monitors them the same way it monitors agents in any other environment. See Send AI agent telemetry.
-
As the service behind evaluations. Omni's evaluators are served through AgentCore Evaluations: built-in, third-party, and custom evaluators come from a single catalog, and on-demand and online evaluations run through it. See Evaluators and evaluations.
Amazon CloudWatch also provides generative AI observability in the AWS Management Console, with prebuilt views for model invocations and AgentCore agents. It is a separate experience from Omni, and both read the telemetry you ingest into CloudWatch, so an AgentCore agent's traces appear in each. Use generative AI observability for its prebuilt views. Use Omni to work in a space — agent telemetry alongside your application telemetry — and for evaluations, evaluation datasets, experiments, and the IDE extension.